Y. OKUBO1,2,3, M. NEMOTO1,2,4, Y. OSUKA1,2,5, S. JUNG1,6, S. SEINO1,2,5, R. FIGUEROA1, G. VINYES-PARES7, E.A. OFFORD8, M. SHEVLYAKOVA8, D. BREUILLE8, K. TANAKA1
1. Faculty of Health and Sport Sciences, University of Tsukuba, Tsukuba, Japan; 2. The Japan Society for the Promotion of Science, 8 Ichiban, Chiyoda, Tokyo, Japan; 3. Falls and Balance Research Group, Neuroscience Research Australia, Sydney, New South Wales, Australia; 4. Faculty of Medicine, University of Tsukuba, Tsukuba, Japan; 5. Tokyo Metropolitan Institute of Gerontology, Itabashi, Tokyo, Japan; 6. National Center for Geriatrics and Gerontology, Obu, Aichi, Japan; 7. Nestlé Research Center, Bunkyo-ku, Tokyo, Japan; 8. Nestlé Research Center, Lausanne, Switzerland
Corresponding author: Yoshiro Okubo, Falls and Balance Research Group, Neuroscience Research Australia, Address: Barker Street Randwick Sydney NSW 2031 Australia, Tel.: +61 2 9399 1065, E-mail: y.okubo@neura.edu.au
J Frailty Aging 2017;in press
Published online October 4, 2017, http://dx.doi.org/10.14283/jfa.2017.38
Abstract
Objective: Develop and evaluate the feasibility and validity of the Nutrition and Functionality Assessment (NFA) which identifies “target” older adults who could benefit from a personalized program following evaluation of their nutrition status and physical functionality. Design: Cross-sectional study. Setting: Community and geriatric day-care centers and university in Japan. Participants: 267 older adults aged 65-90. Measurements: The “target” individuals were screened based on gait speed (0.6-1.5 m/s). Nutrition (Mini Nutrition Assessment-short form and protein intake), strength (30s chair sit-to-stand and hand-grip strength) and endurance (6-minute walk) were assessed. Physical activity was monitored using a tri-axil accelerometer for a week. Fried frailty phenotype was also assessed. Results: Out of 267 individuals, 185 (69%) had gait speed between 0.6-1.5 m/s, corresponding to our “target” group from which, 184 (95%) completed the nutrition and physical functionality assessments with the physical activity monitoring. The NFA was completed in approximately 30 minutes. No adverse events directly due to the NFA were reported. NFA physical functionality and global scores were significantly related to frailty phenotype but nutrition score was not related to frailty phenotype. Conclusion: The study demonstrated that the NFA is a safe and feasible tool to screen target older adults and simultaneously evaluate their nutritional status and physical functionality. Validity of the NFA was partially confirmed by the significant association of the global and physical functionality scores with frailty phenotype. More studies are required to validate and maximize the applicability of the NFA in communities and institutions in Japan and elsewhere.
Key words: nutrition, physical functionality, physical activity, aged, assessment.
Background
The disablement pathway in older age begins silently at the cellular level with, for example, reduced rate of muscle protein synthesis (1), increased rates of muscle protein breakdown and inflammation (2). Altered sensations of thirst, hunger and satiety and reduction in food intake (3) are associated with metabolic, physiological and behavioral alterations leading to decline in muscle mass, strength and mobility, and are manifested as sarcopenia, frailty, malnutrition, and functional dependence (4-6). Regular exercise can activate the physiological systems even in older age, improve the physical function and mitigate disability (7). Appropriate nutrition goes hand in hand with exercise in maintaining physical function because it facilitates post-exercise protein synthesis and inhibits protein breakdown in skeletal muscle (8).
Identifying the early onset of the disablement pathway or functional decline, even before older adults recognize it as a problem, is key for an effective health management strategy in the older population (9). A number of performance-based physical function assessments with good psychometric properties have been developed and used in research and community settings (10). Several nutritional screening tools have also been developed for use specifically in the community setting (11). However, there have been no assessment tools that could capture both the nutritional state and physical function which are the two major, modifiable risk factors of disability in older adults (12, 13). Such comprehensive nutritional and physical assessment tools would be highly beneficial, in providing guidance for a standardized and personalized, nutritional and exercise program to prevent the disability as well as sarcopenia, malnutrition and frailty that are common in older age (4-6).
Here we propose a new assessment tool called “Nutrition and Functionality Assessment (NFA)”. The concept of the NFA is to quickly identify target older individuals using gait speed and provide an easy and reliable assessment of the current nutritional status and physical functionality of the individuals. The NFA stratifies the target older individuals into 3 status levels for each test related to malnutrition, protein-intake, strength and endurance. The compilation of the results of these tests allow to calculate different scores including an NFA global score and sub-scores for nutritional state and physical functionality. These scores and status level of each test are expected to guide health care providers with vital information for a personalized nutrition and exercise program and to be used as a monitoring tool for follow-up evaluation. However, since the NFA has been designed on a theoretical basis, its feasibility and validity among community-dwelling older adults was unclear. Moreover, cut-off values used to stratify the target population needed to be determined using actual data obtained from older adults who underwent the NFA. Therefore, the purpose of this study was to develop and evaluate the feasibility and validity of the NFA among community-dwelling older adults.
Methods
Participants
Participants were recruited through local advertisements and flyers in Ibaraki and Miyagi prefectures, Japan. The study was conducted in a municipal community center, geriatric day-care service, and university in 2013. The eligibility criteria were as follows: (1) aged between 65 and 90 years, (2) able to walk with/without walking aid, and (3) free of cognitive impairment. The exclusion criteria were as follows: (1) doctors restriction on exercise, (2) lower/upper extremity surgery or fracture in the last 3 months, (3) having history of neurological disease with residual impairment, and (4) unable to understand and carry out performance tests and questionnaires correctly. The participants read and signed the informed consent approved by the institutional review board for testing.
The NFA
The NFA consists of 3 steps. First, participants were screened by normal gait speed (m/s) along a 6-m course with 1-m acceleration/deceleration space at each end. The target individuals who would benefit from a personalized, nutritional and exercise program were defined as those with gait speed between 0.6-1.5m/s. We excluded those who walked slower than 0.6m/s (14, 15) who were too frail and would require intensive care or referral to a geriatrician and who walked faster than 1.5m/s (16) for being too fit to benefit from the program. Second, the participants qualified as the target individuals were assessed for nutrition (malnutrition and protein intake) and physical functionality (strength and endurance). The Mini Nutritional Assessment-Short Form (MNA-SF) (17) was used to assess risk of malnutrition. Protein intake was assessed using the brief dietary history questionnaire (BDHQ), consisting of 58-item fixed-portion-type questionnaire (18). Strength was assessed using hand-grip strength (average of 2 trials) and 30s sit-to-stand tests (19). Endurance was assessed using a 6-minute walk test using a 50-meter course (20). Third, physical activity was monitored for 1 week using a 3-axis accelerometer worn at least 12 hours a day (Active style Pro, Omron Inc., Japan).
Calculation of NFA score
For each test performed the participants were stratified into 3 status levels with level 1 being lowest and level 3 being highest. The cutoff values for the malnutrition and protein were based on previously defined classification of risk of malnutrition (1: 0-7 [malnourished], 2: 8-11 [at risk of malnutrition], 3: 12-14 [normal nutritional status]) (17) and protein-intake recommendation for older adults (1: <0.8, 2: 0.8-1.2 and 3: >1.2 g/kg [per body weight]) (21), respectively. The nutrition score was calculated as the sum of the status levels for the malnutrition and protein intake (range: 2-6). The cutoff values of the 3 status levels for the strength and endurance were based on the 33 and 66 percentiles in this sample. The strength status level was calculated as the average of the status levels in the hand-grip strength and sit-to-stand tests. The physical functionality score was calculated as the sum of the status levels for the strength and endurance (range: 2-6). The NFA global score was calculated as the sum of the nutrition and physical functionality scores (range: 4-12).
Feasibility measurements
The feasibility of the NFA was evaluated first by the proportion of the population that was able to complete the NFA, second by the time to fill in the MNA-SF and carry out the physical performance tests (6-min walk, sit-to-stand, and hand-grip strength), third by the incidence of adverse events.
Frailty phenotype
The validity of the NFA was also evaluated by comparison to the frailty phenotype which consisted of 5 frailty indicators: unintentional weight loss, weakness, exhaustion, slowness and low physical activity (4). The participants with 0, 1-2 and 3-5 positive indicators were classified as non-frail, pre-frail and frail.
Sample size estimation
Sample size was estimated based on the 6-minute walk test, to determine 2 cut-off values, 33 and 66 percentiles, to stratify older participants into 3 status levels. Previous studies on older adults reported on average 570 m with a standard deviation of 90 m (22-24). A set of simulations was performed, in order to estimate the standard error of the percentiles: with 150 participants, 33 and 66 percentiles can be estimated with a precision of +/-7%.
Statistical analyses
The cut-off values for the physical functionality tests were determined based on the 33 and 66 percentiles of the target group whose gait speed was between 0.6-1.5 m/s. The association between the nutrition, physical functionality and global scores and the frailty phenotype was examined using the Spearman’s rank correlation coefficient. P < 0.05 was considered to be statistically significant. All the analyses were performed in R statistical software, version 3.0.1.
Results
Screening of the target individuals and baseline demographics
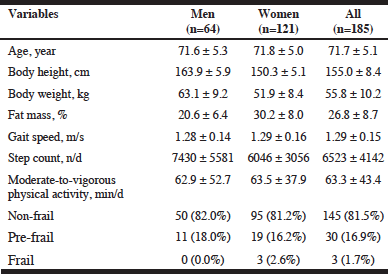
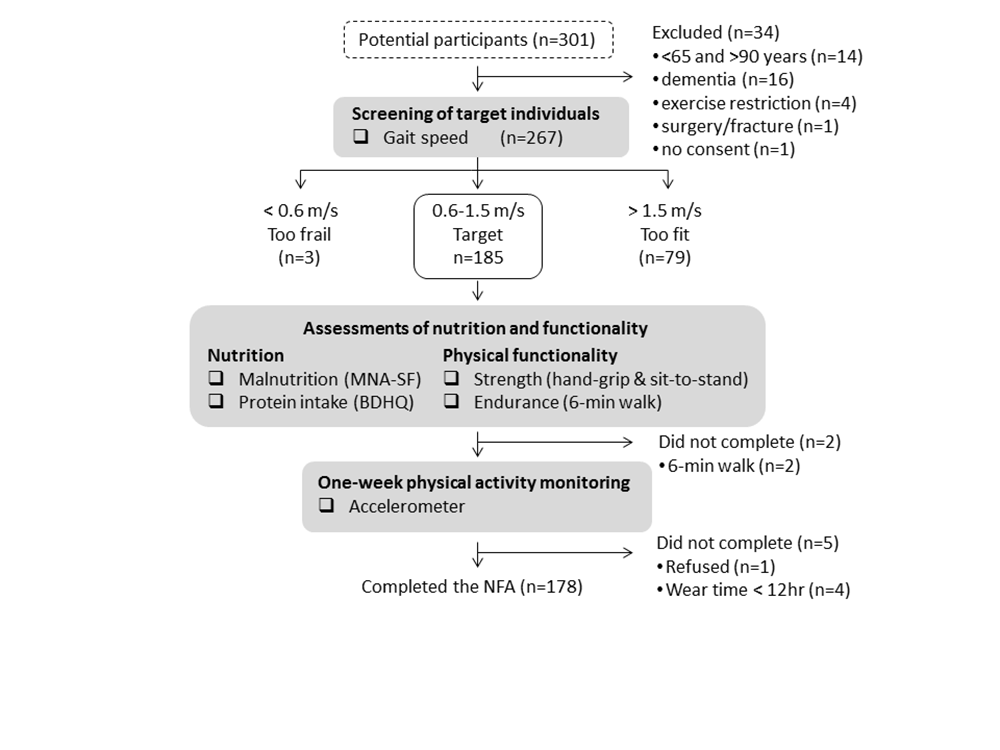
Out of 301 people recruited in the study, 34 were excluded based on the inclusion and exclusion criteria: <65 and >90 years (n=14), dementia (n=16), exercise restriction (n=4), surgery/fracture (n=1) and no consent (n=1). Thus, 267 older adults were enrolled in the study and screened by gait speed. Of the 267 participants, 3 women and 79 participants (29 men and 50 women) were excluded as being too frail (<0.6m/s) and too fit (>1.5m/s) based on the gait speed, respectively. The remaining 185 (69%) participants were qualified as the target individuals for the NFA (Table 1). The target individuals had an average age of 71.7 years and gait speed of 1.29 m/s.
Note: Values are mean ± standard deviation or n (prevalence).
Completion rate of the NFA tools
All the target individuals completed the malnutrition (MNA-SF), protein-intake (BDHQ), hand-grip strength and sit-to-stand. Two women with knee pain chose not to perform the 6-minute walk. Seven participants did not receive/wear the accelerometer properly for 12 hours each day. Subsequently, 178 participants (95%) completed the whole NFA.
Time to complete the NFA
The time to administer MNA-SF and the physical performance tests were 1.2 ± 0.5 minutes and 14.8 ± 2.1 minutes, respectively. This originally planned measure does not include times to measure body height and weight and calculate a body mass index (approximately 4 minutes) for the MNA-SF and to administer the BDHQ (approximately 10 minutes) for the protein intake. Thus, a total of 30 minutes would be required to complete the NFA.
Adverse events
A hip fracture caused by a fall in the neighbourhood was reported but was not related to the NFA. Non-serious adverse events included myalgia (n=5), arthralgia (n=2), back pain (n=2), fatigue (n=1), muscle spasms (n=1), herpes zoster (n=1) and palmar-plantar eryth (n=1). These adverse events were related to the 6-minute walk (n=5), sit-to-stand (n=2) and hand-grip strength (n=2). Two participants already had herpes zoster and palmar-plantar eryth prior to the NFA assessments.
Cut-off values and stratification
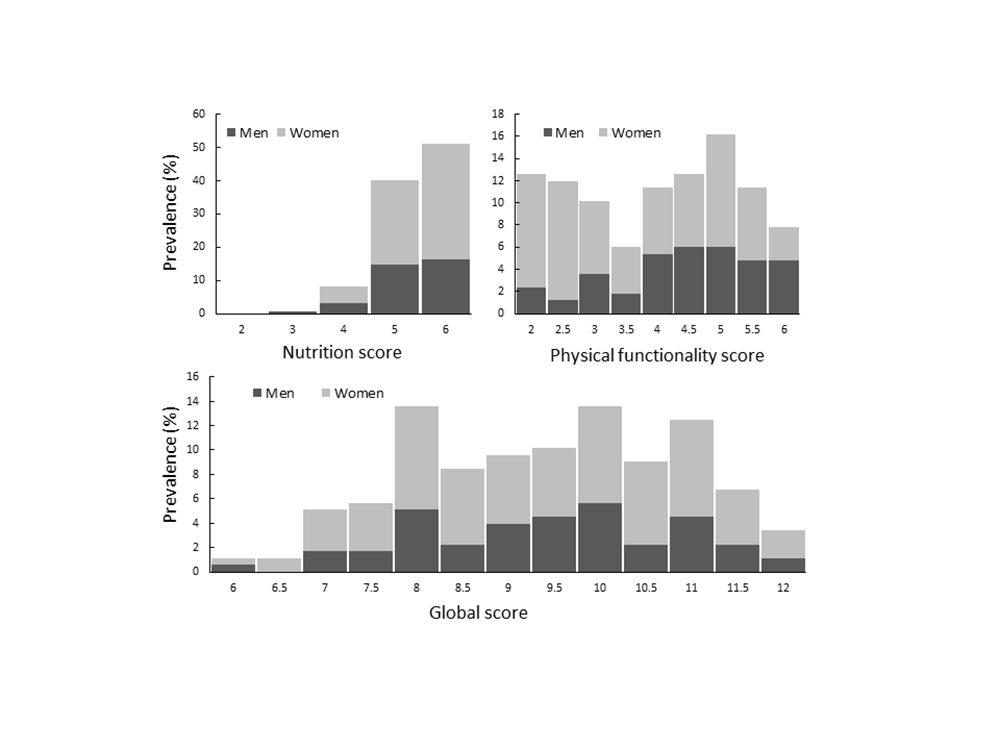
Table 2 presents cut-off values obtained for the NFA. Because of the clear gender difference in the hand-grip strength (12 kg higher in men) and the 6-minute walk (31-51 m higher in men), gender specific cut-off values were adopted for these items. In contrast, we adopted joint cut-off values for the chair sit-to-stand test because the percentile values were very similar for men and women. Figure 2 presents distributions of the calculated NFA scores. The majority of the participants were classified as having normal nutritional status but the physical functionality and global scores were evenly distributed with only 1% and 3% reaching the lowest and highest global scores, respectively.
M and F are values for male and female. MNA-SF: Mini Nutrition Assessment-Short Form; Strength status level = (hand-grip strength level + sit-to-stand level) / 2; Nutrition score (2-6) = malnutrition level (1-3) + protein intake level (1-3); Physical functionality score (2-6) = strength level (1-3) + endurance level (1-3); NFA global score (4-12) = nutrition score (2-6) + physical functionality score (2-6).
MNA-SF: Mini Nutrition Assessment-Short Form, BDHQ: Brief Diet Habit Questionnaire
Correlation between frailty phenotype and the NFA scores
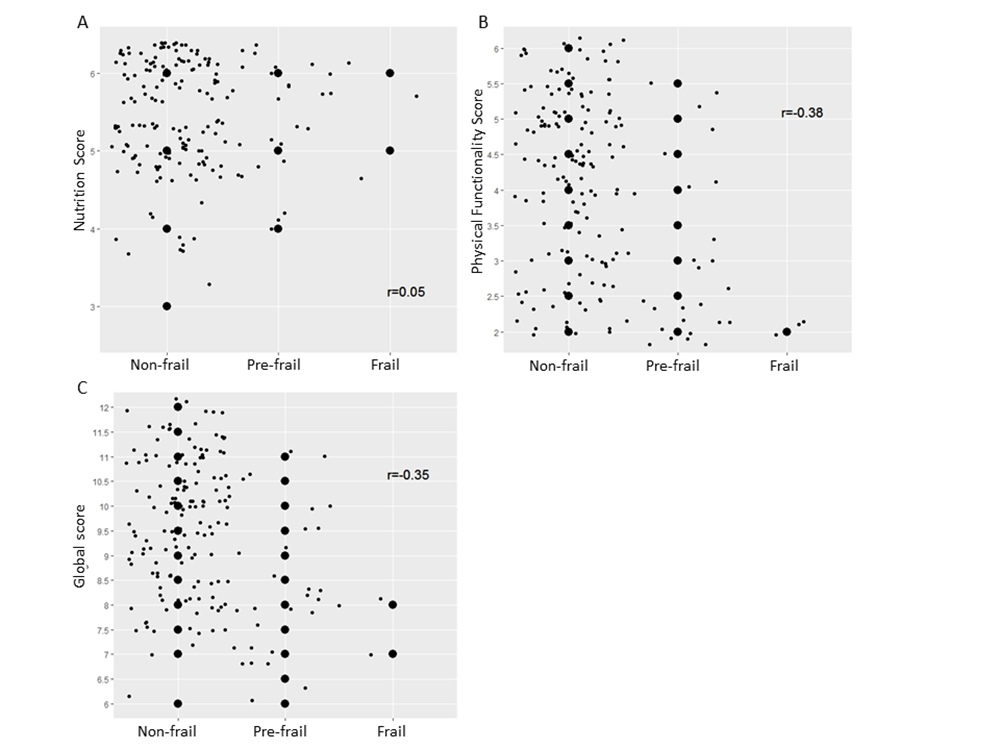
Figure 3 illustrates scatter plots of the NFA nutrition and physical functionality scores and the Fried frailty phenotype. A significant correlation was found between the physical functionality score and the frailty phenotype (r=-0.38, p<0.05), indicating that the frailer a person is, the lower the physical functionality score is. The nutrition score was not correlated with the frailty phenotype (r=0.05, p>0.05). The global score showed significant correlation with the frailty phenotype (r=-0.35, p<0.05).

Figure 3
Scatter plots and Spearman correlation between the frailty phenotype and the NFA (1) nutrition, (2) physical functionality and (3) global scores. The big dots are actual scores (data) but the small dots are virtual data scattered around the actual scores, in order to visualize the number of participants in each category
Discussion
The study demonstrated that the NFA is a safe and feasible tool to screen target individuals and assess both nutritional status and physical functionality of older adults. Validity of the NFA was partially confirmed by the significant association of the global and physical functionality scores with frailty phenotype. However, the nutrition score was not related to frailty phenotype.
Feasibility of the NFA
The completion rate of the NFA was very high (95%). With the exception of 2 participants who chose not to perform the 6-minute walk test for their knee with pain, all other participants were able to perform all the assessment tools in the NFA, which indicates good acceptance by the participants.
Approximately 30 minutes were required to complete the whole NFA with 2 questionnaires and 5 physical performance tests. This was slightly longer than other major physical performance tests such as the Short Physical Performance Battery (3 tests, 10-15 minutes (25)), the Physical Performance Test (7 ADL items, 10-15 minutes (26). Considering the additional nutritional assessments in the NFA, the 30 minutes can be considered reasonable and feasible in most settings, especially in the community. In the institutional setting with lower functioning older adults, it is expected to take longer time to administer.
We observed some non-serious adverse events including arthralgia, back pain, fatigue and muscle spasms related to the NFA. Although most of the participants already had these symptoms before the NFA, it is important to check the physical conditions of all participants before starting. Both testers and participants should be aware of the possibility that the tests could aggravate existing symptoms and not try too hard.
Cut-off values for the NFA
The obtained percentile values are mostly congruent with our hypothetical values derived from previous studies. However, the hand-grip strength values were slightly higher than reference values from representative samples of Japanese older adults (16). The sit-to-stand values and the 6-minute walk distance in the current study were also higher than those of the US counterparts (27). Considering the long life expectancy in Japan (28) and inter-country difference in physical functionality, it may be necessary to examine the NFA values in different countries.
Nutrition status in the present study was normal in most of the participants (78%) while only 2% and 20% were malnourished or at risk of malnourishment, respectively. These results were similar to the general worldwide prevalence of risk of malnutrition (26%) (29). Our study results indicated that most of participants (69%) had protein-intakes above the recommendations for older adults to maintain lean mass (≥1.2g/kg) and only a small part (4%) had intakes below 0.8g/kg (21, 30). Overall results of the nutritional assessments indicated that the population included in our study had a good nutritional status.
There was neither floor nor ceiling effects in the NFA global score as only few participants achieved the lowest (1%) and highest (3%) scores, respectively.
Validity of the NFA against the frailty phenotype
The NFA global and physical functionality scores were confirmed to have moderate but significant association with frailty. However, the nutrition score was not related to the frailty phenotype. Weight loss, a symptom of malnutrition, was the common factor in both the MNA-SF and the frailty phenotype but its prevalence in the target population was very low (≥3kg loss: 0% and 1-3kg loss: 13%). Moreover, compared to the frailty phenotype (4), the nutrition score was consisted wider variety of nutritional aspects including appetite, weight loss, body mass index and protein-intake. The protein-intake, a dietary habit related to current and future risk of physical weakness (30), may be more meaningful in this population and useful for a preventive approach. The uniqueness of the NFA and lack of existing tools to assess both nutrition and physical functionality, made it a challenge to validate the NFA against any existing measures. However, the NFA which also aims to provide useful information for personalized nutrition and exercise program cannot be fully validated without an intervention program. A future clinical trial which uses the NFA to provide seamless screening, assessment and a personalized program to improve nutritional state and physical functionality of older adults is needed.
Limitations
Although the NFA can be used in geriatric facilities, where proportion of demented people is high, its feasibility may be lower. The responsiveness of the NFA to clinically significant changes was not investigated. Further examinations are needed to explore and maximize the applicability of the NFA in communities and institutions in Japan and elsewhere.
Conflict of interest statement: This study was conducted in the University of Tsukuba with financial support by Nestlec Ltd. GVP, EO, MS and DB are employees of Nestec Ltd.
Funding: This study was financial support by Nestlec Ltd. The sponsor was involved in design of the study, analysis and interpretation of data, and preparation of the manuscript.
Acknowledgements: We express our deep gratitude for the members, personnel and volunteers in the University of Tsukuba, Town of Yamamoto and Tsuchiura Fureai Centre Nagamine who contributed in recruitment and data collection. We also thank all the participants in this study.
Ethics: The study protocol was conducted in accordance with the guidelines proposed in the Declaration of Helsinki and the current laws of the country, and was reviewed by the Research Ethics Committee of the University of Tsukuba, Japan (TAI24-51: 06/11/2012).
References
1. Cuthbertson D, Smith K, Babraj J, et al. Anabolic signaling deficits underlie amino acid resistance of wasting, aging muscle. FASEB J 2005;19:422-424.
2. Ibebunjo C, Chick JM, Kendall T, et al. Genomic and proteomic profiling reveals reduced mitochondrial function and disruption of the neuromuscular junction driving rat sarcopenia. Mol Cell Biol 2013;33:194-212.
3. Morley JE. Anorexia, sarcopenia, and aging. Nutrition 2001;17:660-663.
4. Fried LP, Tangen CM, Walston J, et al. Frailty in older adults: evidence for a phenotype. J Gerontol A Biol Sci Med Sci 2001;56:M146-156.
5. Fielding RA, Vellas B, Evans WJ, et al. Sarcopenia: an undiagnosed condition in older adults. Current consensus definition: prevalence, etiology, and consequences. International working group on sarcopenia. J Am Med Dir Assoc 2011;12:249-256.
6. Chen LY, Liu LK, Hwang AC, et al. Impact of Malnutrition on Physical, Cognitive Function and Mortality among Older Men Living in Veteran Homes by Minimum Data Set: A Prospective Cohort Study in Taiwan. J Nutr Health Aging 2016;20:41-47.
7. Pahor M, Guralnik JM, Ambrosius WT, et al. Effect of structured physical activity on prevention of major mobility disability in older adults: the LIFE study randomized clinical trial. JAMA 2014;311:2387-2396.
8. Tipton KD, Ferrando AA, Phillips SM, Doyle D, Jr., Wolfe RR. Postexercise net protein synthesis in human muscle from orally administered amino acids. Am J Physiol 1999;276:E628-634.
9. Brach JS, VanSwearingen JM, Newman AB, Kriska AM. Identifying early decline of physical function in community-dwelling older women: performance-based and self-report measures. Phys Ther 2002;82:320-328.
10. Freiberger E, de Vreede P, Schoene D, et al. Performance-based physical function in older community-dwelling persons: a systematic review of instruments. Age Ageing 2012;41:712-721.
11. Phillips MB, Foley AL, Barnard R, Isenring EA, Miller MD. Nutritional screening in community-dwelling older adults: a systematic literature review. Asia Pac J Clin Nutr 2010;19:440-449.
12. Keller HH, Ostbye T. Nutritional risk and time to death; predictive validity of SCREEN (Seniors in the Community Risk Evaluation for Eating and Nutrition). J Nutr Health Aging 2003;7:274-279.
13. Seidel D, Brayne C, Jagger C. Limitations in physical functioning among older people as a predictor of subsequent disability in instrumental activities of daily living. Age Ageing 2011;40:463-469.
14. Studenski S, Perera S, Wallace D, et al. Physical performance measures in the clinical setting. J Am Geriatr Soc 2003;51:314-322.
15. Quach L, Galica AM, Jones RN, et al. The nonlinear relationship between gait speed and falls: the Maintenance of Balance, Independent Living, Intellect, and Zest in the Elderly of Boston Study. J Am Geriatr Soc 2011;59:1069-1073.
16. Seino S, Shinkai S, Fujiwara Y, et al. Reference values and age and sex differences in physical performance measures for community-dwelling older Japanese: a pooled analysis of six cohort studies. PLoS One 2014;9:e99487.
17. Kaiser MJ, Bauer JM, Ramsch C, et al. Validation of the Mini Nutritional Assessment short-form (MNA-SF): a practical tool for identification of nutritional status. J Nutr Health Aging 2009;13:782-788.
18. Kobayashi S, Murakami K, Sasaki S, et al. Comparison of relative validity of food group intakes estimated by comprehensive and brief-type self-administered diet history questionnaires against 16 d dietary records in Japanese adults. Public Health Nutr 2011;14:1200-1211.
19. Jones CJ, Rikli RE, Beam WC. A 30-s chair-stand test as a measure of lower body strength in community-residing older adults. Res Q Exerc Sport 1999;70:113-119.
20. Kervio G, Ville NS, Leclercq C, Daubert JC, Carre F. Intensity and daily reliability of the six-minute walk test in moderate chronic heart failure patients. Arch Phys Med Rehabil 2004;85:1513-1518.
21. Bauer J, Biolo G, Cederholm T, et al. Evidence-based recommendations for optimal dietary protein intake in older people: a position paper from the PROT-AGE Study Group. J Am Med Dir Assoc 2013;14:542-559.
22. Poh H, Eastwood PR, Cecins NM, Ho KT, Jenkins SC. Six-minute walk distance in healthy Singaporean adults cannot be predicted using reference equations derived from Caucasian populations. Respirology 2006;11:211-216.
23. Bautmans I, Lambert M, Mets T. The six-minute walk test in community dwelling elderly: influence of health status. BMC Geriatr 2004;4:6.
24. Casanova C, Celli BR, Barria P, et al. The 6-min walk distance in healthy subjects: reference standards from seven countries. Eur Respir J 2011;37:150-156.
25. Guralnik JM, Simonsick EM, Ferrucci L, et al. A short physical performance battery assessing lower extremity function: association with self-reported disability and prediction of mortality and nursing home admission. J Gerontol 1994;49:M85-94.
26. VanSwearingen JM, Paschal KA, Bonino P, Chen TW. Assessing recurrent fall risk of community-dwelling, frail older veterans using specific tests of mobility and the physical performance test of function. J Gerontol A Biol Sci Med Sci 1998;53:M457-464.
27. Rikli RE, Jones CJ. Functional Fitness Normative Scores for Community-Residing Older Adults, Ages 60–94. J Aging Phys Act 1999;7:162-181.
28. World Health Organization. World health statistics 2014: A wealth of information on global public health. 2014.
29. Guigoz Y. The Mini Nutritional Assessment (MNA) review of the literature–What does it tell us? J Nutr Health Aging 2006;10:466-485; discussion 485-467.
30. Isanejad M, Mursu J, Sirola J, et al. Dietary protein intake is associated with better physical function and muscle strength among elderly women. Br J Nutr 2016;115:1281-1291.


