
S.S. Ahip1,2, O. Theou2,3, S. Shariff-Ghazali4,5, A.A. Samad6, S. Lukas7, U.K. Mustapha8, R. Visvanathan2,9
1. Kota Samarahan Health Clinic, Sarawak, Malaysia; 2. National Health and Medical Research Council Centre of Research Excellence, Adelaide Medical School and Adelaide Geriatrics Training and Research with Aged Care (GTRAC) Centre, Faculty of Health and Medical Sciences, The University of Adelaide, Adelaide, South Australia, Australia; 3. Physiotherapy and Medicine, Dalhousie University, Halifax, Dalhousie, Canada; 4. Faculty of Medicine and Health Sciences, Universiti Putra Malaysia, Selangor, Malaysia; 5. Malaysian Research Institute on Ageing (MyAgeingTM), Universiti Putra Malaysia, Malaysia; 6. Shah Alam Section 7 Health Clinic, Selangor, Malaysia; 7. Universiti Malaysia Sarawak, Sarawak, Malaysia; 8. Dengkil Health Clinic, Selangor, Malaysia; 9. Aged and Extended Care Services, The Queen Elizabeth Hospital and Basil Hetzel Institute, Central Adelaide Local Health Network, Adelaide, South Australia, Australia
Corresponding Author: Sally Suriani Ahip, Kota Samarahan Health Clinic, Jalan Datuk Mohammad Musa, 94300 Kota Samarahan, Sarawak, Malaysia, sally.ahip@gmail.com, Telephone: +60125880709, Fax number: +6082673632
J Frailty Aging 2023;in press
Published online August 27, 2023, http://dx.doi.org/10.14283/jfa.2023.35
Abstract
The purpose of this study was to evaluate the association between Pictorial Fit Frail Scale-Malay version (PFFS-M) and adverse outcomes, such as falls, new disability, hospitalisation, nursing home placement, and/or mortality, in patients aged 60 and older attending Malaysian public primary care clinics. We assessed the baseline PFFS-M levels of 197 patients contactable by phone at 18 months to determine the presence of adverse outcomes. 26 patients (13.2%) reported at least one adverse outcome, including five (2.5%) who fell, three (1.5%) who became disabled and homebound, 15 (7.6%) who were hospitalized, and three (1.5%) who died. Using binary multivariable logistic regression adjusted for age and gender, we found that patients who were at-risk of frailty and frail at baseline were associated with 5.97(95% CI [1.89-18.91]; P=0.002) and 6.13 (95% CI [1.86-20.24]; P= 0.003) times higher risk of developing adverse outcomes at 18 months, respectively, than patients who were not frail. The PFFS-M was associated with adverse outcomes.
Key words: PFFS, frailty, screening tool, primary care.
Introduction
Population ageing is a global phenomenon, with the number of persons aged 60 and above rising from 200 million in 1950 to 1 billion by 2020, and 2 billion by 2050 (1). Improved healthcare, lower mortality rates, improved socioeconomic development and lower fertility rates have contributed to this achievement (1). In the midst of this unprecedented demographic shift, low and middle-income countries such as Malaysia are ageing much faster than developed countries, with significant implications for health and social care planning and delivery (2).
Malaysia is expected to become an aged nation by 2030, with 15% of the population aged 60 or older (3). As the population ages, the prevalence of age-related conditions such as frailty will rise, making it critical that the healthcare system evolves to better meet the health needs of this growing population group (1, 4).
Frailty is a state of vulnerability caused by cumulative physiological decline over a lifetime, which increases the risk of developing adverse health outcomes such as falls, disability, hospitalisation, institutionalisation, and death following a stressor (5). Frailty prevalence among Malaysian community-dwelling older adults is estimated to be between 5.7% and 9.4% (6, 7).
Frailty, however is reversible and interventions such as exercise and nutrition can help reduce its incidence or impact (8). Therefore, early detection of frailty is critical and we previously proposed that frailty screening programmes be implemented in Malaysia through government-funded primary care services.
The two most used frailty definitions are the phenotypic approach of Fried et al (9) and the frailty index of Rockwood and Mitnitski (10). Frailty is defined by the Fried phenotype as having three or more of the following five characteristics: weak grip strength, slow walking speed, weariness, low physical activity, and accidental weight loss, however Rockwood and Mitnitski utilise the number of «deficits» to calculate a frailty index. These procedures, however, are impractical for identifying frailty in primary care since they are time consuming and involve physical performance measurements.
There are several time efficient and validated screening tools recommended for identifying frailty in older adults in primary care, including the FRAIL scale, the Clinical Frailty Scale (CFS), the Vulnerable Elders Survey-13 (VES-13), the Kihon checklist (KCL), and the Study of Osteoporotic Fractures (SOF) (11). However, these tools have several limitations. The FRAIL and the SOF scales identify frailty with only a small number of symptoms (12, 13) The KCL and the VES-13, assesses multiple health domains and are more comprehensive, but still leave out some important elements such as polypharmacy, continence, pain, vision, and hearing (14, 15). Despite its pictorial design, the CFS requires clinical judgement because it was designed to summarise a comprehensive assessment (16).
The Pictorial Fit Frail Scale (PFFS) is a novel frailty screening tool developed by Theou and Rockwood that comprehensively assesses across 14 health domains (17). The PFFS is reliable when administered by patients, caregivers, and the healthcare professionals in various clinical settings (18–21). Because the PFFS is pictorial in nature, it overcomes language and health literacy barriers; thus, it is suited for Malaysia’s multi-ethnic and multi-lingual population, where poor health literacy is high (22, 23). The PFFS was translated into the Malay language, giving rise to the PFFS-M (Pictorial Fit Frail Scale- Malay version) (24). The reliability and validity of the PFFS-M were established for use with older Malaysians attending publicly funded primary care clinics and cut-offs (i.e. score 6 and above) were also determined to identify frailty when the frailty index was used as the reference method (18) The next step was to investigate the association between the PFFS-M and adverse health outcomes, which had not previously been studied in the primary care setting.
The goal of this study was therefore to determine the association of the PFFS-M across all frailty levels and adverse outcomes defined as death or the presence of either falls, disability, hospitalisation, or nursing home placement.
Methods
Ethics approval
This study reported here complies with the Declaration of Helsinki and was approved by the University of Adelaide Human Research Ethics Committee (HREC- H-2017-149) and the Medical Research and Ethics Committee of the Ministry of Health Malaysia (NMRR-17-543-34884).
Study sample
This study was powered to assess agreement between raters at baseline and determine the reliability and validity of the PFFS-M (25). Two hundred and forty subjects were recruited from four public primary healthcare clinics between April and December 2018 and the results of the baseline study have been published (18). Universal sampling was applied and attempts to contact all patients at 18 months were made. Detailed information about this study sample has been described elsewhere (18).
Study Setting
This research was conducted in four primary care clinics operated by the Ministry of Health of Malaysia in the states of Selangor (Peninsular Malaysia) and Sarawak (Borneo Malaysia). Each state had one rural and one urban clinic involved.
Baseline recruitment
Eligibility criteria for participation included being able to understand Malay, not being acutely ill, having good vision, and presenting with a primary caregiver who would also participate (17).
Baseline Assessments
For this study, the PFFS-M was used to identify patients’ frailty levels at the baseline. The PFFS-M is a pictorial tool that scores across fourteen health domains including mobility, function, cognition, social support, affect, medication, incontinence, vision, hearing, balance and aggression (17). For each domain, scores ranging from 3-6 are recorded, with the best health on the left and the worst health on the right. A higher total score indicates greater frailty, with a maximum total score of 43. Participants were excluded if more than 20% of the data was missing (26) We identified frailty levels using the previously identified PFFS-M cut-offs: a) non-frail (PFFS-M scores 0-3); b) at-risk of frailty (PFFS-M scores 4-5); and c) frail (PFFS-M scores 6 and above) (18).
Age and gender were collected as baseline variables and were used as covariates. Ethnicity, marital status, education level, occupational status, household income, house ownership, living conditions, alcohol consumption, educational level, and smoking status were also used to characterise the study cohort.
Outcomes Assessment: Follow up after 18months
After 18 months, all patients were contacted by phone using their or their primary caregivers’ phone numbers. Patients and/or primary caregivers who could not be reached at the phone numbers previously registered were phoned two more times, one day apart, before being deemed uncontactable.
Once contact had been established, self-reported data were recorded. The participant’s survival was confirmed during the phone call, with deaths reported by the deceased’s next of kin. Participants were asked if they had experienced any of the following events in the previous 18 months: a) falls; b) new disability; c) nursing home placement; d) hospitalisation; and e) death. Disability was defined as difficulty or dependency in mobility (walking, moving outdoors) and performing activities necessary for independent living, including self-care tasks such as walking indoors, using the toilet, washing, bathing, dressing and undressing, feeding) (27). Nursing home placement was defined as permanent placement in a long-term care institution (28). Hospitalisation was defined as a hospital admission for at least one day. Adverse outcomes included any of the events outlined above.
Statistical Analysis
The Statistical Package for Social Sciences (SPSS) software version 25 was used to analyse the data. Descriptive statistics are reported as means with standard deviations (SD) or percentages. Chi-square and independent t-tests were used to compare baseline characteristics of those contacted and uncontacted at 18 months. All tests were two-sided with a p< 0.05 significance level. A binary multivariable logistic regression adjusted for age and gender, was used to investigate the association between adverse outcomes (Yes/ No) at 18 months and baseline PFFS-M frailty categories: non-frail (PFFS-M scores 0-3); at-risk of frailty (PFFS-M scores 4-5); and frail (PFFS-M scores 6 and above). A Hosmer-Lemeshow goodness-of-fit test indicated that the assumption of proportional odds was met.
Results
Of the original 240 patients who participated in the baseline study in 2018, 197 (82.1%) patients or their caregivers were contactable in the 18-month follow-up, representing an attrition rate of 17.9% (n=43). The patients who were not contactable in the 18-month follow up were older (69.6 vs. 67.4 years, p= 0.024), had lower education levels (69.7% vs 30.3%, p 0.001), had lower mean MMSE scores (24 vs. 26, p 0.001), had lower KATZ ADL scores (5.69 vs. 5.91, p=0.029) and had higher PFFS-M scores (5.28 vs 3.83, p=0.014). (Supplementary Table 1)
Most of the included participants were females (60.4%), mean age was 67.4 (5.9) years, mostly reside in the urban areas (81.2%), have higher education (62%), and living with their family members (46.7%). Majority had multimorbidity (63.7%), however, more than half of the included patients had no frailty at baseline (55.8%) and were independent older persons. (Table 1)
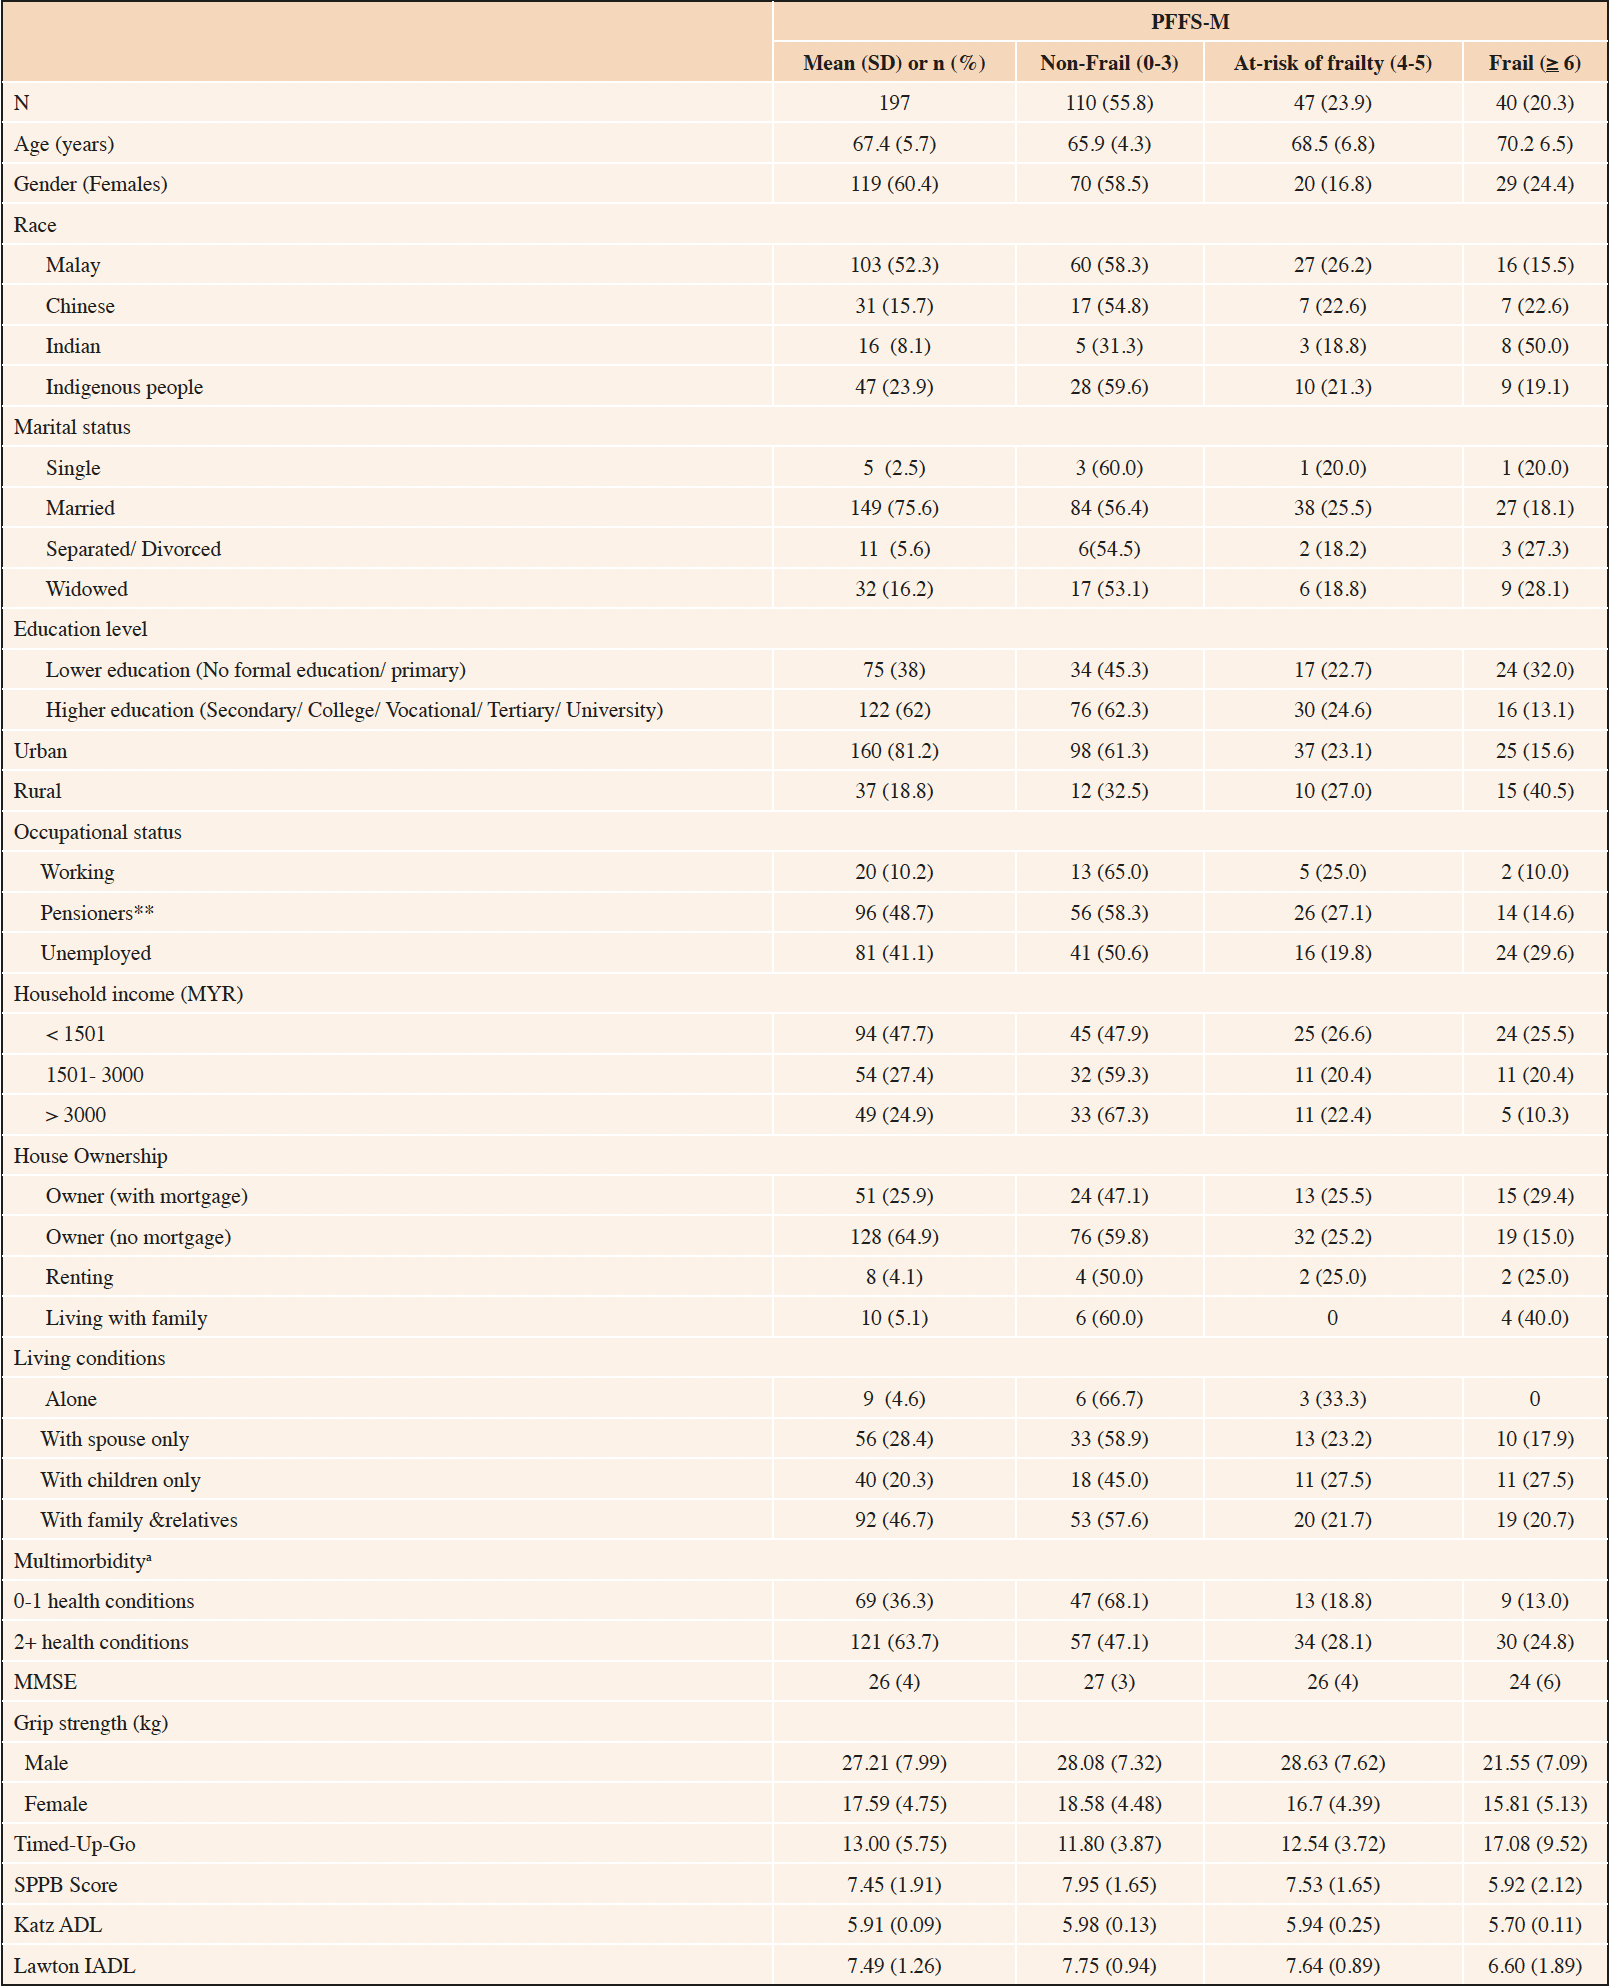
Table 1. Descriptive baseline sociodemographic and clinical characteristics of the included patients
a. Missing not included; **in receipt of Malaysian government pension; MYR, Malaysian Ringgit; PFFS-M, Pictorial Fit Frail Scale-Malay version; MMSE, Mini Mental State Examination; SPPB, Short Physical Performance Battery; ADL, Activities of Daily living; IADL, Instrumental Activities of Daily living
Incidence of adverse outcomes
26 (13.2%) of the 197 patients reported at least one adverse event. Three patients (1.5%) had died. Five people reported having fallen, 10 were disabled, and 15 were hospitalized. None had been placed in a nursing home.
Association with adverse health outcomes at follow-up
The unadjusted odds ratios for patients identified as at-risk of frailty (PFFSM scores 4-5) and frail (PFFS-M scores 6 and above), developing adverse outcomes compared to that non-frail (PFFS score <4), were 6.42 (95% CI [2.09-19.7]; P=0.001) and 7.0 (95% CI [2.22-22.1], P=0.001), respectively. The odds ratios for both groups remained significant after adjusting for age and gender, where the odds of patients at-risk of frailty and identified as frail for developing adverse outcomes were 5.97(95% CI 1.89-18.91; P=0.002) and 6.13(95% CI 1.86-20.24; P= 0.003), respectively than a patient who was not frail. (Table 2).
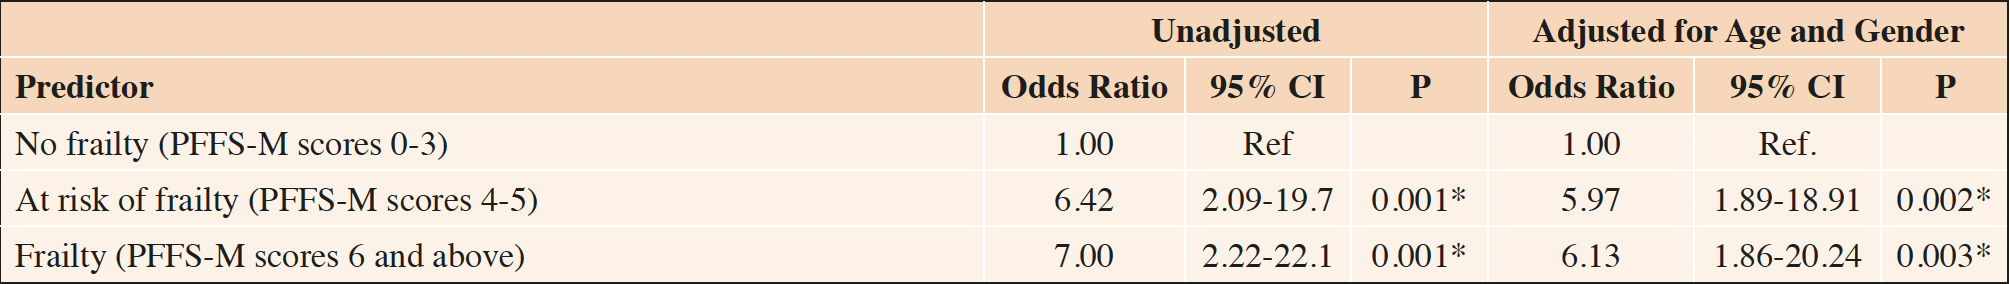
Table 2. Unadjusted and Adjusted Odds Ratios for Developing Adverse Outcomes among patients who were at risk for frailty or frail, compared to patients who were not frail
*p-value with two-tailed test < 0.05; Ref., reference category
Discussion
The PFFS-M has been described as a simple, acceptable and valid frailty screening tool for use in primary care by patients, caregivers and varying skilled healthcare professionals (18, 24). In this primary care study, the PFFS-M was associated with adverse outcomes at 18 months. This to our knowledge is the first study globally reporting on the association between PFFS and adverse outcomes of frailty, thus provides a foundation to guide the implementation of clinical screening programs in primary care and the monitoring for effectiveness of interventions in real world settings. When compared to the non-frail group, the risk of adverse outcomes was higher in the at-risk group and frail patient groups. Whilst we had previously recommended interventions for primary care patients identified as moderately or severely frail on the PFFS-M (scores >9) (18) to mirror the practice in the United Kingdom (29), this new finding suggests that intervention may be required at an earlier stage and that intervention should occur even for those with scores >4. Patients in the early stages of frailty, including those at-risk of frailty, may have their frailty risk reduced through comprehensive assessments and targeted interventions. Through medication optimisation, exercise and nutritional supplementation it would be possible to obviate adverse outcomes for these patients, such as falls and hospitalisation which are costly, not only to individuals and family, but also to the health system (8).
There are several limitations to this study. Patients not contacted at 18 months were older and frailer and so they may have been more likely to experience adverse outcomes. Also, the reliance on self-report after 18 months meant that some negative outcomes might have been forgotten and not reported. Self-reporting over the phone, on the other hand, allowed for the retention of a larger sample size because it was not dependent on patients presenting to the clinic for follow-up. The use of an event diary and ascertaining outcomes through more frequent contact to shorten the period of recall could reduce recall bias, and is a recommendation for future studies (30). Also, being able to visit patients at home may reduce the attrition rate. The prevalence of each of the adverse outcomes making up the composite measure reported in this study was low. This would contribute to the study being underpowered (43.9%) and the association between frailty and each adverse outcome measure could not be assessed independently. Therefore, result of this study should be treated with caution as the limited sample size and low adverse outcomes prevalence did not allow us to do a more rigorous analysis (e.g. survival analysis). However, given that there has previously been no research investigating the association between the PFFS and adverse outcomes, this research provides a strong foundation to guide the design of definitive study.
Future longitudinal cohort research could investigate the association with individual outcomes (e.g., hospitalisation) rather than a composite measure and should be designed to include less healthy patients, recruit a larger sample size at baseline, implement measures to reduce recall bias when relying on self-reported outcomes, follow-up patients over a longer period to allow for the emergence of adverse outcomes and focus on minimising patient attrition over time. Additionally, implementation research to evaluate the roll out of frailty screening programs and the effectiveness of interventions in the real world is recommended.
Conclusion
The PFFS-M is associated with adverse health outcomes in 18 months, according to this study and frailty intervention may need to occur for those with PFFS-M scores >4.
Funding: This study was funded by the Ministry of Health Malaysia Research Grant (NMRR 17-543-348840). The sponsors had no role in the design and conduct of the study; in the collection, analysis, and interpretation of data; in the preparation of the manuscript; or in the review or approval of the manuscript. Open Access funding enabled and organized by CAUL and its Member Institutions.
Acknowledgements: The authors would like to acknowledge all the staff of the public primary care clinics and district/divisional health offices of the study sites involved.
Conflict of interest: Dr. Olga Theou and Kenneth Rockwood have asserted copyright of the Pictorial Fit-Frail Scale, which is made freely available for education, research, and not-for-profit health care. Licenses for commercial use are facilitated through the Dalhousie Office of Commercialization and Industry Engagement. All other authors have no conflict of interest to disclose in relation to this research.
Ethical standards: The authors ensure that this is an original work and presented accuratedly. All authors have significant and equal contribution in all aspects of this research project.
Open Access: This article is distributed under the terms of the Creative Commons Attribution 4.0 International License (http://creativecommons.org/licenses/by/4.0/), which permits use, duplication, adaptation, distribution and reproduction in any medium or format, as long as you give appropriate credit to the original author(s) and the source, provide a link to the Creative Commons license and indicate if changes were made.
References
1. Bloom DE, Luca DL. The Global Demography of Aging. Vol 1. 1st ed. Elsevier B.V.; 2016. doi:10.1016/bs.hespa.2016.06.002
2. NoorAni A, Rajini S, Balkish MN, et al. Morbidity patterns and healthcare utilisation among older people in Malaysia: 1996–2015. Public Health. 2018;163:105-112. doi:10.1016/j.puhe.2018.06.018
3. Samad S, Mansor N. Population Ageing and Social Protection in Malaysia. Malaysian J Econ Stud. 2013;50(2):139-156. http://search.proquest.com/docview/1471984460/.
4. Collard RM, Boter H, Schoevers RA, Oude Voshaar RC. Prevalence of frailty in community-dwelling older persons: A systematic review. J Am Geriatr Soc. 2012;60(8):1487-1492. doi:10.1111/j.1532-5415.2012.04054.x
5. Clegg A, Young J, Iliffe S, Rikkert MO, Rockwood K. Frailty in elderly people. Lancet. 2013;381(9868):752-762. doi:10.1016/S0140-6736(12)62167-9
6. Ahmad NS, Hairi NN, Said MA, et al. Prevalence, transitions and factors predicting transition between frailty states among rural community-dwelling older adults in Malaysia. PLoS One. 2018;13(11):1-16. doi:10.1371/journal.pone.0206445
7. Sathasivam J, Kamaruzzaman SB, Hairi F, Ng CW, Chinna K. Frail Elders in an Urban District Setting in Malaysia: Multidimensional Frailty and Its Correlates. Vol 27. Los Angeles, CA: SAGE Publications; 2015.
8. Travers J, Romero-Ortuno R, Bailey J, Cooney MT. Delaying and reversing frailty: A systematic review of primary care interventions. Br J Gen Pract. 2019;69(678):E61-E69. doi:10.3399/bjgp18X700241
9. Fried LP, Tangen CM, Walston J, et al. Frailty in older adults: evidence for a phenotype. J Gerontol A Biol Sci Med Sci. 2001;56(3).
10. Rockwood K, Song X, MacKnight C, et al. A global clinical measure of fitness and frailty in elderly people. Can Med Assoc J. 2005;173(5):489-495.
11. Ruiz JG, Dent E, Morley JE, et al. Screening for and Managing the Person with Frailty in Primary Care: ICFSR Consensus Guidelines. J Nutr Heal Aging. 2020;24(9):920-927. doi:10.1007/s12603-020-1492-3
12. Morley JE, Malmstrom TK, Miller DK. A simple frailty questionnaire (FRAIL) predicts outcomes in middle aged african americans. J Nutr Heal Aging. 2012;16(7):601-608. doi:10.1007/s12603-012-0084-2
13. Ensrud KE, Ewing SK, Taylor BC, et al. Comparison of 2 frailty indexes for prediction of falls, disability, fractures, and death in older women. Arch Intern Med. 2008;168(4):382-389. doi:10.1001/archinternmed.2007.113
14. Satake S, Senda K, Hong YJ, et al. Validity of the Kihon Checklist for assessing frailty status. Geriatr Gerontol Int. 2016;16(6):709-715. doi:10.1111/ggi.12543
15. Fun S. Management Update on Functional decline in older adults. Singapore Fam Physician. 2012;38(1). https://www.cfps.org.sg/publications/the-singapore-family-physician/article/82_pdf.
16. Theou O, Pérez-Zepeda MU, Van Der Valk AM, Searle SD, Howlett SE, Rockwood K. A classification tree to assist with routine scoring of the Clinical Frailty Scale. Age Ageing. 2021;50(4):1406-1411. doi:10.1093/ageing/afab006
17. Theou O, Andrew M, Ahip S, et al. The Pictorial Fit-Frail Scale: Developing a Visual Scale to Assess Frailty. Can Geriatr J. 2019;22(2):64-74. http://search.proquest.com/docview/2241218310/.
18. Ahip SS, Ghazali SS, Theou O, et al. The Pictorial Fit-Frail Scale—Malay version (PFFS-M): reliability and validity testing in Malaysian primary care. Fam Pract. 2022;(August 2022):290-299. doi:10.1093/fampra/cmac089
19. Wallace LMK, McGarrigle L, Rockwood K, Andrew MK, Theou O. Validation of the Pictorial Fit-Frail Scale in a memory clinic setting. Int Psychogeriatrics. 2019:1–10. doi:10.1017/S1041610219000905
20. Cooper L, Deeb A, Dezube AR, et al. Validation of the Pictorial Fit-Frail Scale in a Thoracic Surgery clinic. Ann Surg. 2022;Publish Ah(5). doi:10.1097/sla.0000000000005381
21. Chehrehgosha M, Alizadeh-Khoei M, Behnampour N, Sharifi F, Fadaye Vatan R, Aminalroaya R. Diagnosis of frailty in geriatric patients: Is the pictorial fit frail scale an appropriate screening tool in hospital settings? Casp J Intern Med. 2021;12(3):307-314. doi:10.22088/cjim.12.3.307
22. E, Azreena; I, Suriani; J, Muhamad Hanafiah; P F. Factors associated with health literacy among Type 2 Diabetes Mellitus patients attending government among Type 2 Diabetes Mellitus patients attending a government health clinic. Int J Public Heal Clin Sci. 2016;3(6):50-64.
23. Ysea-Hill O, Sani TN, Nasr LA, et al. Concurrent Validity of Pictorial Fit-Frail Scale (PFFS) in Older Adult Male Veterans with Different Levels of Health Literacy. Gerontol Geriatr Med. 2021;7. doi:10.1177/23337214211003804
24. Ahip SS, Shariff-Ghazali S, Lukas S, et al. Translation, adaptation and pilot testing of the pictorial fit-frail scale (PFFS) for use in Malaysia – The PFFS-Malay version (PFFS-M). Malaysian Fam physician. 2021;16(2):27-36.
25. Martin Bland J, Altman D. Statistical methods for assessing agreement between two methods of clinical measurement. Lancet (British Ed. 1986;327(8476):307-310.
26. Searle SD, Mitnitski A, Gahbauer EA, Gill TM, Rockwood K. A standard procedure for creating a frailty index. BMC Geriatr. 2008;8:1-10. doi:10.1186/1471-2318-8-24
27. Fried LP, Ferrucci L, Darer J, Williamson JD, Anderson G. Untangling the Concepts of Disability, Frailty, and Comorbidity: Implications for Improved Targeting and Care. Journals Gerontol – Ser A Biol Sci Med Sci. 2004;59(3):255-263. doi:10.1093/gerona/59.3.m255
28. Mor V, Thomas KS, Rahman M. Defining and Measuring Nursing Home Placement. J Am Geriatr Soc. 2018;66(10):1866-1868. doi:10.1111/jgs.15546
29. Identifying frailty. National Health Service, UK. https://www.england.nhs.uk/ourwork/clinical-policy/older-people/frailty/frailty-risk-identification/. Published 2021. Accessed July 23, 2021.
30. Althubaiti A. Information bias in health research: Definition, pitfalls, and adjustment methods. J Multidiscip Healthc. 2016;9:211-217. doi:10.2147/JMDH.S104807
The Author(s) 2023