H.J. Coelho-Júnior1, A. Álvarez-Bustos1,2, L. Rodríguez-Mañas2, I. de Oliveira Gonçalves3, R. Calvani1, A. Picca1,5, M.C. Uchida4, S. da Silva Aguiar6,7, E. Marzetti1,8
1. Department of Geriatrics, Orthopedics and Rheumatology, Center for Geriatric Medicine (Ce.M.I.), Università Cattolica del Sacro Cuore, Largo Francesco Vito 1, 00168, Rome, Italy; 2. Centro de Investigación Biomédica en Red sobre Fragilidad y Envejecimiento Saludable (CIBERFES), Instituto de Salud Carlos III, Madrid, Spain; 3. Department of Health, Piaget University, Av. Mogi das Cruzes 1001, 08673-010, Suzano – SP, Brazil; 4. Applied Kinesiology Laboratory, School of Physical Education, University of Campinas, Campinas, Brazil; 5. Department of Medicine and Surgery, LUM University, Str. Statale 100 Km 18, 70100 Casamassima, Italy; 6. University Centre UDF, Faculty of Physical Education, Brasília, Brazil; 7. Federal University of Mato Grosso, Mato Grosso, Brazil; Physical Education Department, University Center UDF, Brasília, DF, Brazil; 8. Fondazione Policlinico Universitario “Agostino Gemelli” IRCCS, Largo Agostino Gemelli 8, 00168, Rome, Italy
Corresponding Author: Hélio José Coelho-Júnior & Emanuele Marzetti, Department of Geriatrics, Orthopedics and Rheumatology, Università Cattolica del Sacro Cuore, 00168 Rome, Italy, coelhojunior@hotmail.com.br (H.J.C.-J.), emanuele.marzetti@policlinicogemelli.it (E.M.); +39 (06) 3015-4859
J Frailty Aging 2024;in press
Published online June 11, 2024, http://dx.doi.org/10.14283/jfa.2024.50
Abstract
BACKGROUND: Muscle power assessment entails the use of complex equipment which impacts its clinical applicability. Recently, equations to estimate lower-limb muscle power measures based on 5-repetition sit-to-stand (5STS) performance and anthropometric parameters were validated. However, their ability to discriminate physical performance status in older adults is still unknown. Moreover, the analysis of the biomechanical aspects of 5STS might represent a valid instrument to identify people with different physical statuses.
OBJECTIVES: Explore and examine the biomechanical aspects of 5STS performance, and compare the capacity of this measure and 5STS muscle power equations to discriminate older women with different physical function levels.
DESIGN: Cross-sectional study. Setting: Community. Participants: Older women. Measurements: 5STS using a linear encoder, Timed “Up-andGo” (TUG), isometric handgrip strength (IHG) and walking speed (WS).
RESULTS: Results from ANOVA analysis indicated that peak concentric muscle power was reached in the first 5STS repetition and then declined significantly (P= 0.006). When participants were divided in high and low physical performance groups according to median results of TUG, IHG and WS tests, significant differences in 5STS biomechanical aspects were observed, according to independent t-test results (P< 0.05). However, no differences were found for 5STS muscle power equations. Pearson’s correlation analysis indicated that 5STS biomechanical aspects (P< 0.05), but not 5STS muscle power equations, were significantly associated with physical performance.
CONCLUSION: Findings of the present study suggest that 5STS biomechanical aspects might contribute to discriminating older women with high and low physical performance.
Key words: Physical evaluation, muscle strength, frailty, sarcopenia.
Introduction
Muscle power is the maximum strength that can be generated over a short period of time (1). During aging, muscle power declines earlier and to a greater extent than other physical performance parameters (e.g., muscle strength) (2–5). In terms of sex-specific changes, it is observed that women experience more significant declines in muscle power compared to men (3, 6). In older adults, muscle power is a strong, independent predictor of mobility disability, poor functional status, hospitalization, and death (3–5, 7). Comparative studies have found that this physical capacity is a better indicator of musculoskeletal health (3), physical performance (4), mobility (5), functional independence (8), and death (7) than muscle strength.
Measurement of muscle power entails the use of complex equipment which impacts its clinical applicability. More recently, equations to estimate lower-limb muscle power measures based on 5-repetition sit-to-stand (5STS) performance and anthropometric parameters were validated (8). Although several studies have found significant associations between these estimations of muscle power and health outcomes (8–10), not all investigations have confirmed their association with physical performance (7, 10). Moreover, some authors argued that 5STS-based muscle power equations should be refined due to the presence of conceptual problems in the operationalization of concentric movements (11).
Lower-limb muscle power impacts physical performance through its contribution to the production of more complex motor gestures. Indeed, muscle power might be associated with the propulsion required to climb stairs and walk fast (4) and the ability to rapidly respond to balance challenges (12, 13). Notably, these motor tasks demand different phases of muscle power, from maximal concentric performance to eccentric actions, which might not be entirely captured by the time taken to perform the 5STS test. As such, it may be proposed that the analysis of specific biomechanical aspects of 5STS performance could represent a valid discriminator of people with different physical function levels.
These premises are partially supported by prior empirical observations (14–17) that found significant associations between muscle power obtained during a single stand movement using a linear encoder and physical performance tests, including gait speed, handgrip strength, and 30s chair STS performance. In addition, this method of muscle power measurement can distinguish fallers from non-fallers (18).
To provide further and more detailed information on this topic, the present study explored and examined the biomechanical aspects of 5STS performance, and compared the capacity of this measure and 5STS muscle power equations to discriminate older women with high and low physical function levels.
Methods
This is an observational cross-sectional study that described the biomechanical aspects of 5STS performance in older women. We also compared the association between 5STS biomechanical aspects, and 5STS muscle power equations, with physical performance measures. This study was approved by the Research Ethics Committee of the University of Mogi das Cruzes (UMC, São Paulo, Brazil). All study procedures were conducted in compliance with the Declaration of Helsinki and the Resolution 196/96 of the National Health Council. The article was prepared according to the Strengthening the Reporting of Observational Studies in Epidemiology criteria (19).
Participant recruitment took place between January 2015 and January 2018. Participants were recruited in a community senior center located in the metropolitan area of São Paulo, Poá, Brazil. The study was advertised through posters placed in public sites (e.g., parks, city hall, public offices, bus stops, and train stations) as well as via local radio and newspapers. People were also invited to participate by direct contact. Candidates were considered eligible if they were 60 years or older, lived independently, and possessed sufficient physical and cognitive abilities to perform all measurements required by the protocol. No other selection criteria were set. Written informed consent was obtained before inclusion from each participant.
5-Time Sit-To-Stand Test (5STS)
5STS was performed twice and the best result was used for analysis. The test involved rising from a chair 5 times as quickly as possible with arms folded across the chest. Timing began when participants raised their buttocks off the chair and was stopped when they were seated at the end of the fifth stand. Time performance was quantified using a stopwatch (Vollo Sports, São Paulo, Brazil). A 50-Hz linear encoder (Peak Power, CEFISE, Brazil) was attached to the wrist of the arm that was at the waist to obtain absolute muscle power (AMP, W). Then, concentric (MPC1-5) and eccentric (MPE1-5) muscle power variables were created from each stand and sit movement. The duration of each concentric (DC1-5) and eccentric (DE1-5) movement was also obtained. The delta (Δ) of variation from the first concentric (ΔMPC2-5) and eccentric (ΔMPE2-5) movements was calculated. Compositive scores summing the duration of concentric (DC1-2, DC1-3, DC1-4) and eccentric variables (DE1-2, DE1-3, DE1-4) were also created.
Absolute (AMP_EQUA), relative (adjusted by body weight) (RMP), and allometric (adjusted by height) muscle power (ALMP) values were estimated according to the equations proposed by Alcazar et al. (11):
Physical Performance Tests
Maximum isometric strength of metacarpophalangeal joints was measured by isometric handgrip strength (IHG) testing. Participants remained seated comfortably on a chair with their shoulders in a neutral position. The arm being assessed (dominant arm) had the elbow flexed at 90º near the torso, and the hand neutral with thumb up. A maximal contraction was performed over four seconds using a handheld hydraulic dynamometer (Jamar®, USA). The Timed “Up and Go!” (TUG) test involved getting up from a chair without the help of the arms, walking a distance of three meters around a marker placed on the floor, coming back to the same position, and sitting back on the chair. The test began when a researcher shouted a “go!” command. The stopwatch was activated when participants got up from the chair and was stopped when they were seated again. To measure walking speed (WS), a three-meter WS test was performed. Participants were required to walk a distance of five meters at their usual cadence. Before testing, both feet remained on the starting line. Measurement was initiated when a foot reached the one-meter line and was stopped when a foot reached the four-meter line. The one-meter intervals at the beginning and end were used to avoid early acceleration and/or deceleration.
Anthropometry
Body height and weight were measured through a stadiometer and an analog medical scale, respectively. The body mass index (BMI) was then calculated as the ratio between body weight (kg) and the square of height (m2).
Statistical Analysis
Normality of data was ascertained using the Kolmogorov-Smirnov test. Data are presented as mean (standard deviation). One-way repeated measures within-subject analysis (ANOVA) was conducted to examine differences in 5STS, AMP, and duration parameters among the repetitions and test the existence of a regression linear model. Participants were divided into high and low function performance groups according to the median results of TUG (13 s), WS (1.3 m/s), and IHG (28 kg) tests. Differences in 5STS muscle power equations and biomechanical aspects were examined through independent t-tests. Pearson’s correlation was conducted to examine the correlations between 5STS parameters and physical performance tests. Significance was set at 5% (P < 0.05) for all tests. All analyses were performed using the SPSS software (version 23.0, SPSS Inc., Chicago, IL).
Results
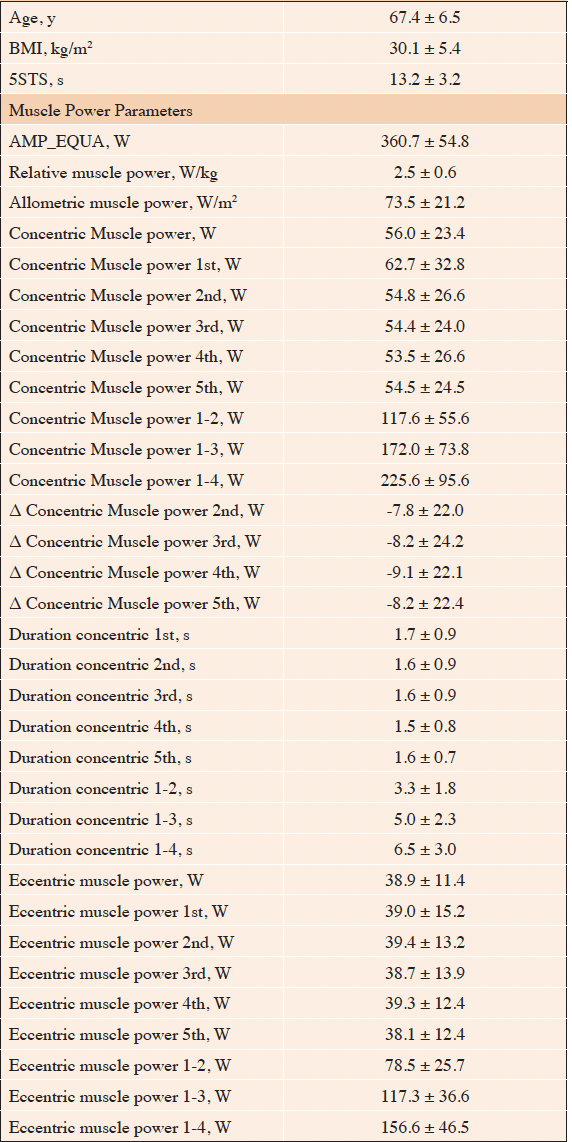
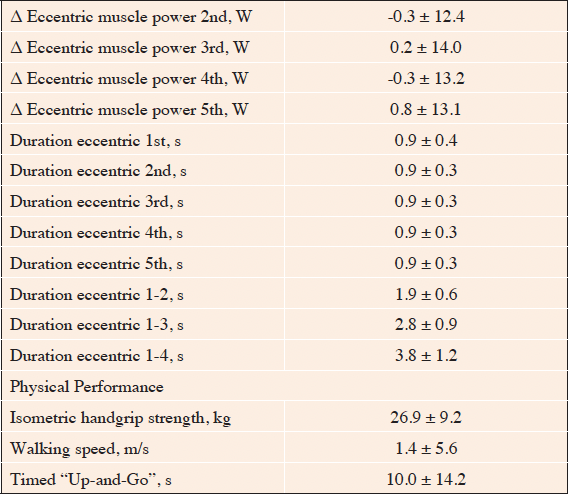
The main characteristics of study participants are shown in Table 1. Older women were relatively young (67.4 ± 6.5 years) and had a mean BMI (30.1 ± 5.4 kg/m2) indicative of overweight/obesity. 5STS performance ranged from 4 to 22 s, with an average time of 13.2 s (± 3.2), suggesting that most participants had preserved physical performance. Results of the TUG (10.0 ± 14.2 s) and WS (1.1 ± 0.5 m/s) tests further supported the good physical status of study participants. Average IHG performance (26.9 ± 9.2 kg) was borderline to sarcopenia.
5STS= 5-time sit-to-stand test, AMP_EQUA= Absolute muscle power derived from equations, BMI= Body mass index.
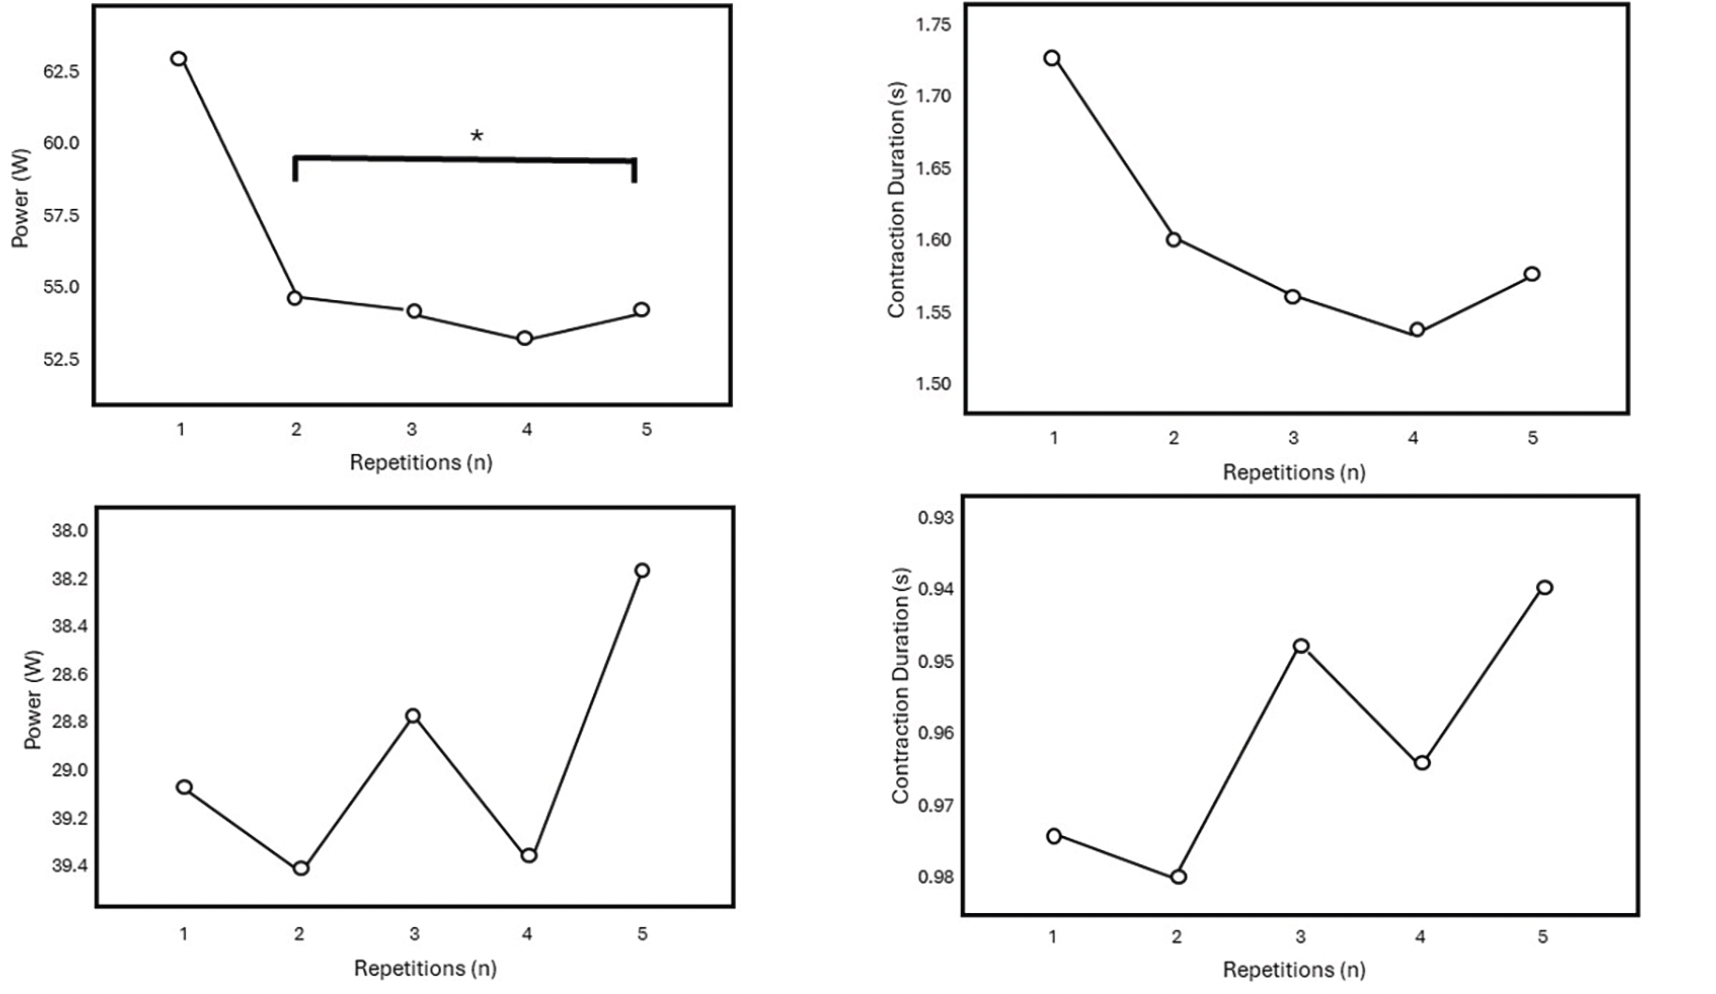
AMP and contraction duration during concentric and eccentric phases across the 5STS test recorded using the linear encoder are shown in Figure 1. The peak of AMP during the concentric phase was reached in the first repetition and significantly declined thereafter. A linear trend of decline was observed (P= 0.006). No other significant differences were identified.
*P<0.05 vs 1st repetition
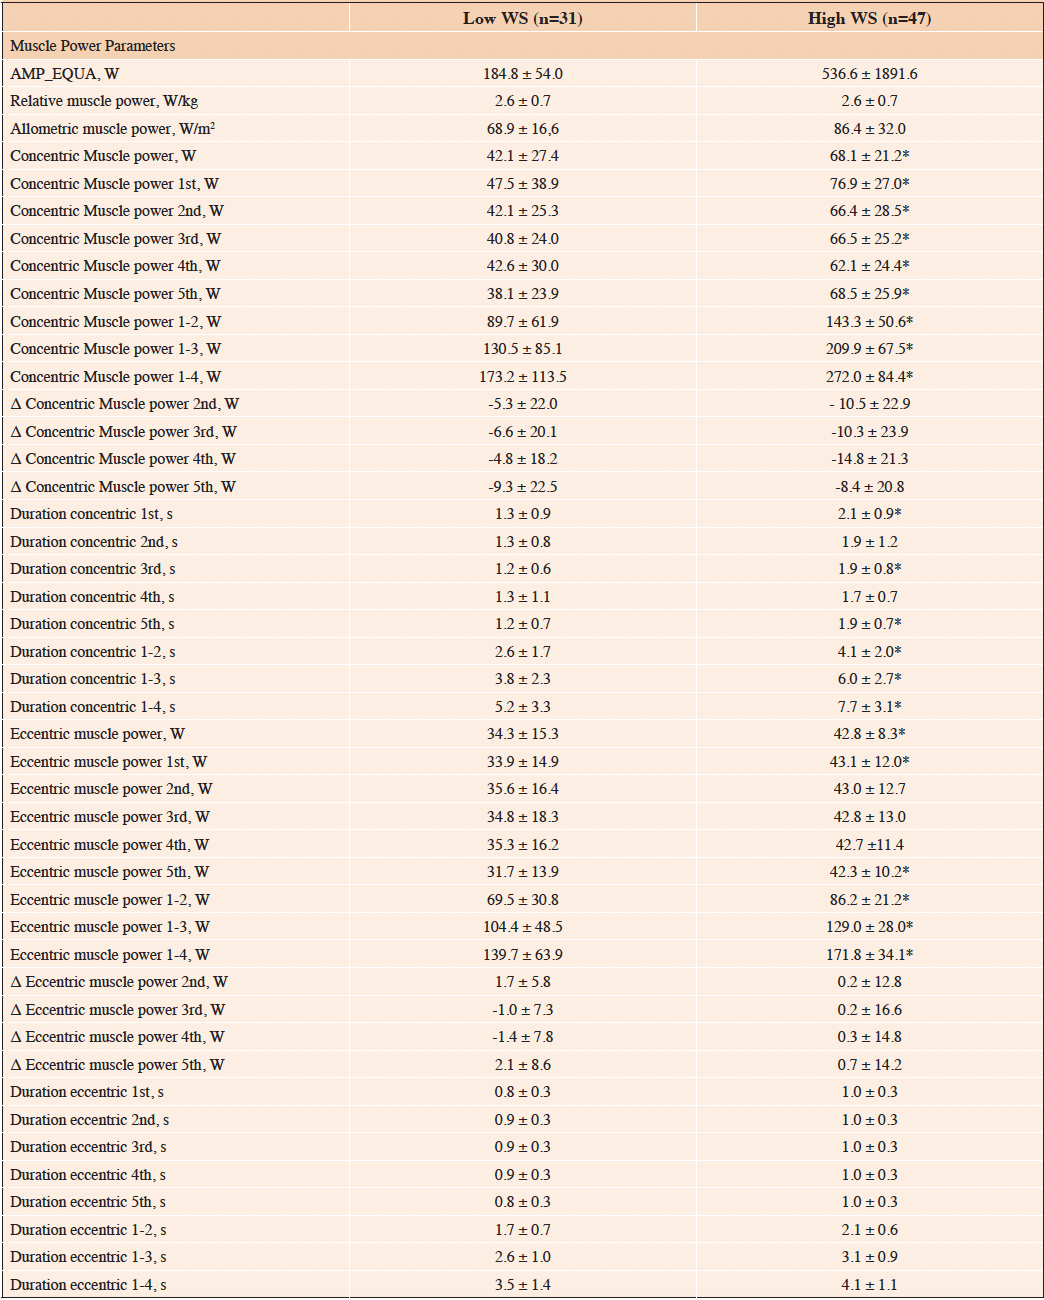
Differences in 5STS-based biomechanical aspects according to the performance on WS, TUG, and IHG tests are shown in Table 2 and supplementary material (SM) 1 and 2. No significant differences in AMP, RMP, or ALMP estimated according to 5STS equations were observed between participants with high and low physical performance. In contrast, participants with high or low WS had significant differences in MPC, MPC1, MPC2, MPC3, MPC4, MPC5, MPC1-2, MPC1-3, MPC1-4, DC1, DC3, DC1-2, DC1-3, DC1-4, MPE, MPE1, MPE5, MPE1-2, MPE1-3, and MPE1-4 (Table 2). When participants were compared according to their performance on TUG (SM1) and IHG (SM2), only differences in MPE3 and MPC5 reached significance.
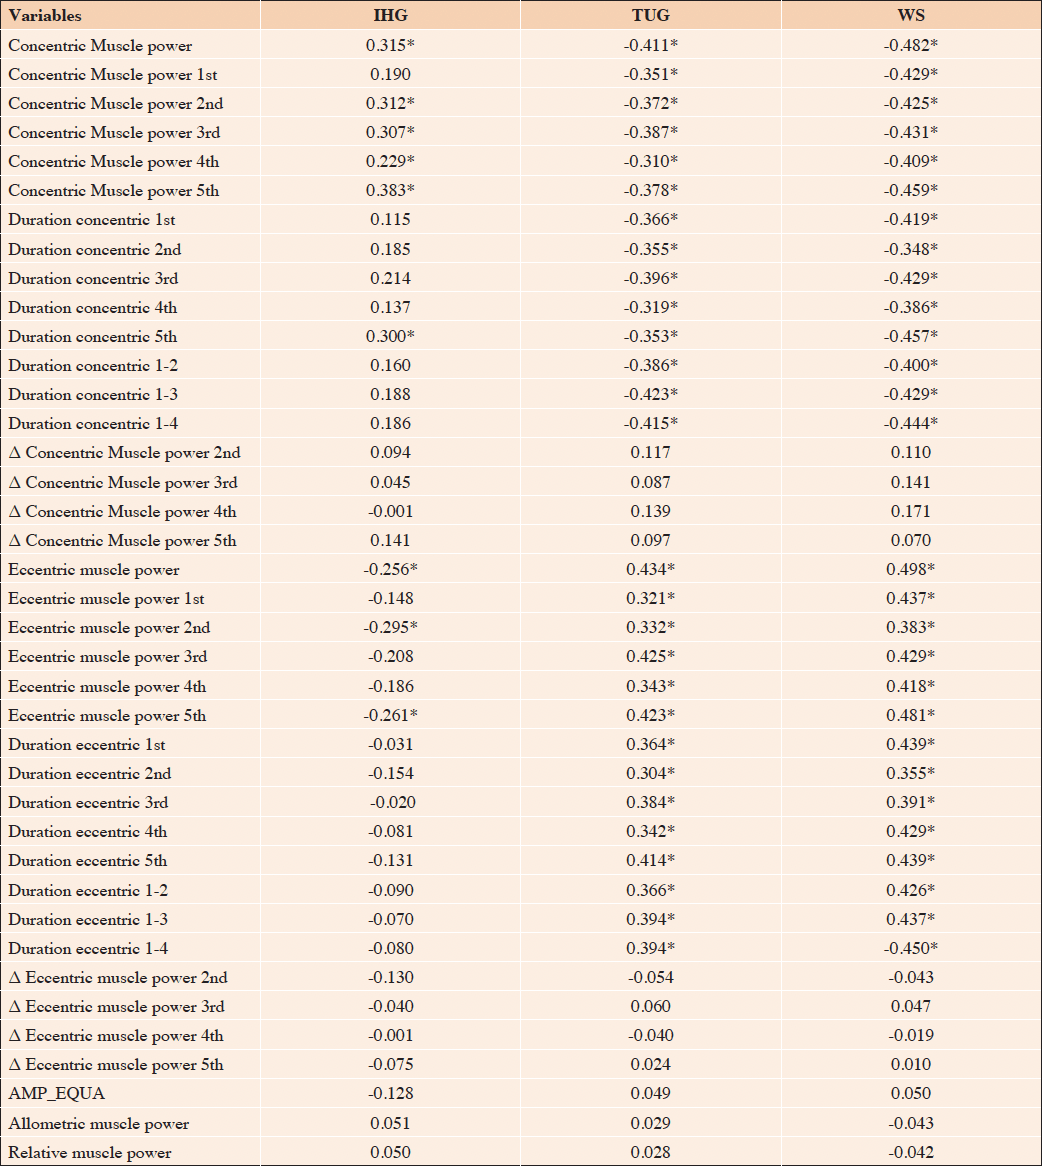
Results of Pearson’s correlations between 5STS-based biomechanical aspects and physical performance tests of sarcopenia are shown in Table 3. Aspects of muscle power recorded with the linear encoder and the duration of concentric and eccentric contractions were significantly correlated with IHG, TUG, and WS. Specifically, MPC, MPC2, MPC3, MPC4, MPC5, DC5, MPE, MPE2, and MPE5 were significantly associated with all physical performance tests. MPC1, DC1, DC2, DC3, DC4, DC5, DC1-2, DC1-3, DC1-4, MPE1, MPE3, MPE4, DE1, DE2, DE3, DE4, DE5, DE1-2, DE1-3, and DE1-4 were significantly associated with both TUG and WS, but not IHG. No parameters were exclusively associated with IHG, TUG or WS. Moreover, no significant correlations were observed between 5STS muscle power equations and physical performance measures.
AMP_EQUA= Absolute muscle power derived from equations, IHG= Isometric handgrip strength, TUG= Timed “Up-and-Go”, WS= Walking speed, *P<0.05
When results were adjusted according to BMI (SM3), all MPC, DC, and MPE (except for EC2) variables become significantly associated with physical performance tests. Furthermore, DE1, DE2, DE3, DE4, DE5, DE1-2, DE1-3, and DE1 remained significantly associated with TUG and WS. In contrast, a positive and significant associations was found between AMP and the time to perform the TUG test.
Discussion
The assessment of lower limb muscle power is an important aspect of the physical evaluation of older adults by providing relevant insights on physical status. This information, in turn, may be used by, contributing to health professionals in the identification of individuals at high risk of experiencing negative events, and to devise the best therapeutic approach. Yet, the clinical evaluation of muscle power is hampered by the lack of an unequivocal assessment tool. Our findings indicate that peak lower limb muscle power is reached in the first concentric contraction and declines significantly thereafter (Figure 1). Furthermore, we observed that 5STS-based biomechanical aspects demonstrate a good capacity to discriminate individuals according to WS performance (Table 2). We also noted that muscle power during specific contractions might contribute to differentiating older women with low and high performance on TUG (SM1) and IHG tests (SM2). Notably, such associations were not observed with muscle power estimated according to 5STS equations. Pearson’s correlation analysis suggested similar results (Table 3 and SM3).
The fact that peak lower-limb muscle power was reached during the first stand movement might suggest that one sit-to-stand action could be a sufficient representation of lower-limb muscle power in older adults. The capacity to produce power decreases in tasks requiring high velocities and is exacerbated during repeated contractions, including cyclic STS movements (20–22). Muscle power is primarily produced by the activity of type II muscle fibers, those more sensitive to fatigue (23–25). As muscles are required to continue producing strength at high velocities, the availability of ATP and phosphocreatine of type II muscle fibers becomes insufficient (24, 26, 27), leading fatigue-resistant fibers to become protagonists of muscle actions (24), causing significant reductions in power output (24, 25).
In the present study, AMP during the second concentric contraction (stand movement) was significantly reduced by 12.5% in comparison to the first muscle action. These abrupt and meaningful losses might represent structural and metabolic changes commonly observed in old muscles, mainly in type II muscle fibers, including relative reduction of these fiber types, reduced phosphorylation of the fast myosin regulatory light chain and rates of myosin force production, and longer myosin attachment times (25).
No significant differences were found in the duration or velocity of sit movements among eccentric contractions (Figure 1). However, visual inspection revealed a “W-shaped” curve during eccentric contractions, in which oscillations are noted between the 2nd-4th and 1st-3rd-5th repetitions. These observations suggest that older adults might have problems controlling eccentric actions performed after explosive moments. These premises are partially supported by clinical observations, given that frail individuals, mainly those institutionalized and hospitalized, have two major motor behaviors when they have to sit: i) extremely controlled movement and ii) fast movement due to incapacity to sustain body weight.
Eccentric actions involve a lower activation of motoneurons, when compared to concentric actions, and a specific recruitment of type II muscle fibers (25). It has been seen that eccentric muscle strength presents a virtually lesser decline with age in comparison to concentric and isometric muscle actions, leading many authors to argue that this physical capacity is preserved in advanced age (28). However, these conclusions are obtained after testing exclusively eccentric actions (28) and no studies have examined the impact of explosive movements in a subsequent capacity to generate eccentric strength. In one of the few studies examining this subject, it was found that fatigue induced significant decreases in eccentric muscle strength, mainly when it is required during high velocities (29).
Although this interpretation is only speculative, these results emphasize the need for more specific investigations to understand if the patterns of eccentric actions noted during 5STS are a result of type II muscle fibers’ overload, in which movements in the boundaries, with extreme caution and/or inability to sustain body weight, reveal the lack of strength to maintain muscle actions. Slow (controlled) eccentric movements produce worse performance on 5STS and are captured in test results. But then, a question that arises from this view is whether fast eccentric actions, and consequent better 5STS results, represent good performance or neuromuscular weakness.
Results indicated that 5STS-based biomechanical aspects were better discriminators and more associated with IHG, TUG, and WS performances than 5STS muscle power equations (Table 2, SM1, SM2, SM3). These findings are partially supported by other investigations that found no significant associations between muscle power estimated according to 5STS performance and WS (10). This scenario is surprising given that TUG and WS performances are dependent on muscle power (13, 30–32).
5STS-based muscle power equations have faced criticism due to their assumption that only a portion of the body’s mass accelerates during the concentric phase of movement, whereas the production of mechanical power in similar conditions should account for alterations in the kinetic and potential energy of the entire body (11). The authors also highlighted conceptual problems with the definition of the concentric phase (11). Notably, both 5STS-based muscle power equations aspects criticized by Fabrica & Biancardi (11) are associated with the concentric phase of the movement, in which more balance is likely required (33), affecting TUG performance, and is associated with the propulsion required to move fast in mobility tasks (4).
On the other hand, the analysis of individual biomechanical aspects captures specific moments of physical tasks (e.g., propulsion, dynamic balance), which explain the association among these parameters. The fact, for example, that significant differences in MPE3 were found between participants with high and low TUG performance suggests that eccentric actions might be a better discriminator of mobility than concentric and combined contractions. Moreover, Pearson’s correlation results indicate that numerous biomechanical 5STS parameters (e.g., MPC, MCP2, MCP3, MCP4, MCP5, DC5, MPE2) were significantly associated with IHG, TUG, and WS, suggesting that all these variables might contribute to identifying people with low physical function.
The fact that MPC, MPE, and DC variables becamesignificantly associated with physical performance tests when results were adjusted according to BMI, suggests an important role of body mass distribution in this scenario. Individuals with higher BMI need to produce more strength than those with lower BMI values to move the body rapidly during sit and stand movements. The inability to generate strength properly in these circumstances reflects in lower power production and longer contraction durations and might explain the associations observed in the adjusted analysis.
The present study is not free of limitations. First, specific muscle power, adjusted according to muscle mass (e.g., computer tomography, magnetic resonance imaging, or dual X-ray Absorptiometry), was not estimated in the present study. Second, participants were not screened for sarcopenia or frailty. Third, important information associated with the presence of chronic conditions, such as pharmacological therapy and disease status, was not recorded. Fourth, only community-dwelling women were examined, and extrapolations to men or people in other contexts (e.g., institutionalized) should be made with caution. Fifth, correlation analysis was not corrected according to numerous covariables that might influence muscle power, including physical activity levels, diet quality, and sleep. Sixth, the linear encoder only captures movements in one plane, indicating that disturbances during sit and stand actions were not recorded. Finally, the results shown in this work are derived from cross-sectional observations. The possibility cannot be ruled out that differences in birth cohorts may have influenced some of the assessed parameters. A deeper understanding of age-dependent differences in muscle power requires an analysis of prospective data that are unavailable at this stage for our study.
Conclusion and Implications
The operationalization of our findings is complex. However, results of the present study indicate that examining the biomechanical aspects of 5STS performance might contribute to distinguishing older adults with different physical performance levels. Moreover, if confirmed, our results indicate that a simpler physical evaluation might be conducted to assess lower-limb muscle power in people with difficulties in performing many repetitions at high velocities, such as older adults suffering from chronic pain, mobility limitations, fatigue, respiratory diseases, cancer, and cognitive impairment. More studies are necessary to further explore the potential of our results.
Acknowledgements: We would like to thank Luca Sicoli and Rosa Benz for their intellectual input.
Conflicts of Interest: The authors have no conflicts of interest to declare.
Ethical Standards: This study was conducted according to the guidelines laid down in the Declaration of Helsinki, and all procedures involving human subjects/patients were approved by the Research Ethics Committee of the University of Mogi das Cruzes (UMC, São Paulo, Brazil) . Written informed consent was obtained for all subjects.
Funding: Open access funding provided by Università Cattolica del Sacro Cuore within the CRUI-CARE Agreement.
Open Access: This article is distributed under the terms of the Creative Commons Attribution 4.0 International License (http://creativecommons.org/licenses/by/4.0/), which permits use, duplication, adaptation, distribution and reproduction in any medium or format, as long as you give appropriate credit to the original author(s) and the source, provide a link to the Creative Commons license and indicate if changes were made.
References
1. Sapega AA, Drillings G. The definition and assessment of muscular power. J Orthop Sports Phys Ther 1983;5:7–9. doi.10.2519/jospt.1983.5.1.7
2. Reid KF, Fielding RA. Skeletal muscle power: a critical determinant of physical functioning in older adults. Exerc Sport Sci Rev 2012;40:4–12. doi:10.1097/JES.0b013e31823b5f13
3. Lauretani F, Russo CR, Bandinelli S, et al. Age-associated changes in skeletal muscles and their effect on mobility: an operational diagnosis of sarcopenia. J Appl Physiol (1985) 2003;95:1851–1860. doi:10.1152/japplphysiol.00246.2003
4. Suzuki T, Bean JF, Fielding RA. Muscle power of the ankle flexors predicts functional performance in community-dwelling older women. J Am Geriatr Soc 2001;49:1161–1167. doi:10.1046/j.1532-5415.2001.49232.x
5. Bean JF, Leveille SG, Kiely DK, Bandinelli S, Guralnik JM, Ferrucci L. A comparison of leg power and leg strength within the InCHIANTI study: which influences mobility more? J Gerontol A Biol Sci Med Sci 2003;58:728–733. doi:10.1093/gerona/58.8.m728
6. Coelho-Junior HJ, Marzetti E, Picca A, Tosato M, Calvani R, Landi F. Sex- and age-specific normative values of lower extremity muscle power in Italian community-dwellers. J Cachexia Sarcopenia Muscle 2024;15:45–54. doi:10.1002/jcsm.13301
7. Coelho-Júnior HJ, Calvani R, Álvarez-Bustos A, et al. Physical performance and negative events in very old adults: a longitudinal study examining the ilSIRENTE cohort. Aging Clin Exp Res 2024;36:1–12. doi:10.1007/s40520-024-02693-y
8. Hetherington-Rauth M, Magalhães JP, Alcazar J, et al. Relative Sit-to-Stand Muscle Power Predicts an Older Adult’s Physical Independence at Age of 90 Yrs Beyond That of Relative Handgrip Strength, Physical Activity, and Sedentary Time: A Cross-sectional Analysis. Am J Phys Med Rehabil 2022;101:995–1000. doi:10.1097/PHM.0000000000001945
9. Alcazar J, Aagaard P, Haddock B, et al. Age- and Sex-Specific Changes in Lower-Limb Muscle Power Throughout the Lifespan. J Gerontol A Biol Sci Med Sci 2020;75:1369–1378. doi:10.1093/gerona/glaa013
10. Baltasar-Fernandez I, Alcazar J, Rodriguez-Lopez C, et al. Sit-to-stand muscle power test: Comparison between estimated and force plate-derived mechanical power and their association with physical function in older adults. Exp Gerontol 2021;145:111213. doi:10.1016/j.exger.2020.111213
11. Fabrica G, Biancardi CM. Commentary: The sit-to-stand muscle power test: An easy, inexpensive and portable procedure to assess muscle power in older people. Exp Gerontol 2022;158:111652. doi:10.1016/j.exger.2021.111652
12. Orr R, de Vos NJ, Singh NA, Ross DA, Stavrinos TM, Fiatarone-Singh MA. Power training improves balance in healthy older adults. J Gerontol A Biol Sci Med Sci 2006;61:78–85. doi:10.1093/gerona/61.1.78
13. Coelho-Junior HJ, Rodrigues B, Gonçalves I de O, Asano RY, Uchida MC, Marzetti E. The physical capabilities underlying timed “Up and Go” test are time-dependent in community-dwelling older women. Exp Gerontol 2018;104:138–146. doi:10.1016/j.exger.2018.01.025
14. Sherwood JJ, Inouye C, Webb SL, Jenny O. Reliability and Validity of the Sit-to-Stand as a Muscular Power Measure in Older Adults. J Aging Phys Act 2019;28:455–466. doi:10.1123/japa.2019-0133
15. Orange ST, Metcalfe JW, Liefeith A, Jordan AR. Validity of various portable devices to measure sit-to-stand velocity and power in older adults. Gait Posture 2020;76:409–414. doi:10.1016/j.gaitpost.2019.12.003
16. Stagsted RAW, Ramari C, Skjerbaek AG, Thrue C, Dalgas U, Hvid LG. Lower extremity muscle power – A critical determinant of physical function in aging and multiple sclerosis. Exp Gerontol 2021;150:111347. doi: 10.1016/j.exger.2021.111347
17. Lindemann U, Farahmand P, Klenk J, Blatzonis K, Becker C. Validity of linear encoder measurement of sit-to-stand performance power in older people. Physiotherapy 2015;101:298–302. doi:10.1016/j.physio.2014.12.005
18. Vincenzo JL, Gray M, Glenn JM. Validity of a Novel, Clinically Relevant Measure to Differentiate Functional Power and Movement Velocity and Discriminate Fall History Among Older Adults: A Pilot Investigation. Innov Aging 2018;2:igy028. doi: 10.1093/geroni/igy028
19. von Elm E, Altman DG, Egger M, et al. The Strengthening the Reporting of Observational Studies in Epidemiology (STROBE) Statement: guidelines for reporting observational studies. Int J Surg 2014;12:1495–9 1499. doi:10.1016/j.ijsu.2014.07.013
20. Callahan DM, Kent-Braun JA. Effect of old age on human skeletal muscle force-velocity and fatigue properties. J Appl Physiol (1985) 2011;111:1345–1352. doi:10.1152/japplphysiol.00367.2011
21. Beelen A, Sargeant AJ. Effect of fatigue on maximal power output at different contraction velocities in humans. J Appl Physiol (1985) 1991;71:2332–2337. doi:10.1152/jappl.1991.71.6.2332
22. Lindemann U, Klenk J, Becker C. Assessment of fatigability of older women during sit-to-stand performance. Aging Clin Exp Res 2016;28:889–893. doi:10.1007/s40520-015-0495-0
23. Sargeant AJ. Human power output and muscle fatigue. Int J Sports Med 1994;15:116–121. doi:10.1055/s-2007-1021031
24. Sargeant AJ. Structural and functional determinants of human muscle power. Exp Physiol 2007;92:323–331. doi:10.1113/expphysiol.2006.034322
25. Cherry PW, Lakomy HKA, Nevill ME, Maddox NL. Effect of the number of preceding muscle actions on subsequent peak power output. J Sports Sci 1997;15:201–206. doi:10.1080/026404197367470
26. Sant’Ana Pereira JAA, Sargeant AJ, Rademaker ACHJ, De Haan A, Van Mechelen W. Myosin heavy chain isoform expression and high energy phosphate content in human muscle fibres at rest and post-exercise. J Physiol 1996;496 ( Pt 2):583–588. doi:10.1113/jphysiol.1996.sp021709
27. Karatzaferi C, De Haan A, Van Mechelen W, Sargeant AJ. Metabolism changes in single human fibres during brief maximal exercise. Exp Physiol 2001;86:411–415. doi:10.1113/eph8602223
28. Roig M, MacIntyre DL, Eng JJ, Narici M V., Maganaris CN, Reid WD. Preservation of eccentric strength in older adults: Evidence, mechanisms and implications for training and rehabilitation. Exp Gerontol 2010;45:400–409. doi:10.1016/j.exger.2010.03.008
29. El-Ashker S, Chaabene H, Prieske O, et al. Effects of Neuromuscular Fatigue on Eccentric Strength and Electromechanical Delay of the Knee Flexors: The Role of Training Status. Front Physiol 2019;10:782. doi:10.3389/fphys.2019.00782
30. Cuoco A, Callahan DM, Sayers S, Frontera WR, Bean J, Fielding RA. Impact of muscle power and force on gait speed in disabled older men and women. J Gerontol A Biol Sci Med Sci 2004;59:1200–6 1206. doi:10.1093/gerona/59.11.1200
31. Kuo HK, Leveille SG, Yen CJ, et al. Exploring how peak leg power and usual gait speed are linked to late-life disability: Data from the National Health and Nutrition Examination Survey (NHANES), 1999-2002. Am J Phys Med Rehabil 2006;85:650–658. doi:10.1097/01.phm.0000228527.34158.ed
32. Bean JF, Kiely DK, LaRose S, et al. Are Changes in Leg Power Responsible for Clinically Meaningful Improvements in Mobility Among Older Adults? J Am Geriatr Soc 2010;58:2363–2368. doi:10.1111/j.1532-5415.2010.03155.x
33. Lord SR, Murray SM, Chapman K, Munro B, Tiedemann A. Sit-to-stand performance depends on sensation, speed, balance, and psychological status in addition to strength in older people. J Gerontol A Biol Sci Med Sci 2002;57:M539-543. doi:10.1093/gerona/57.8.m539
The Author(s) 2024


